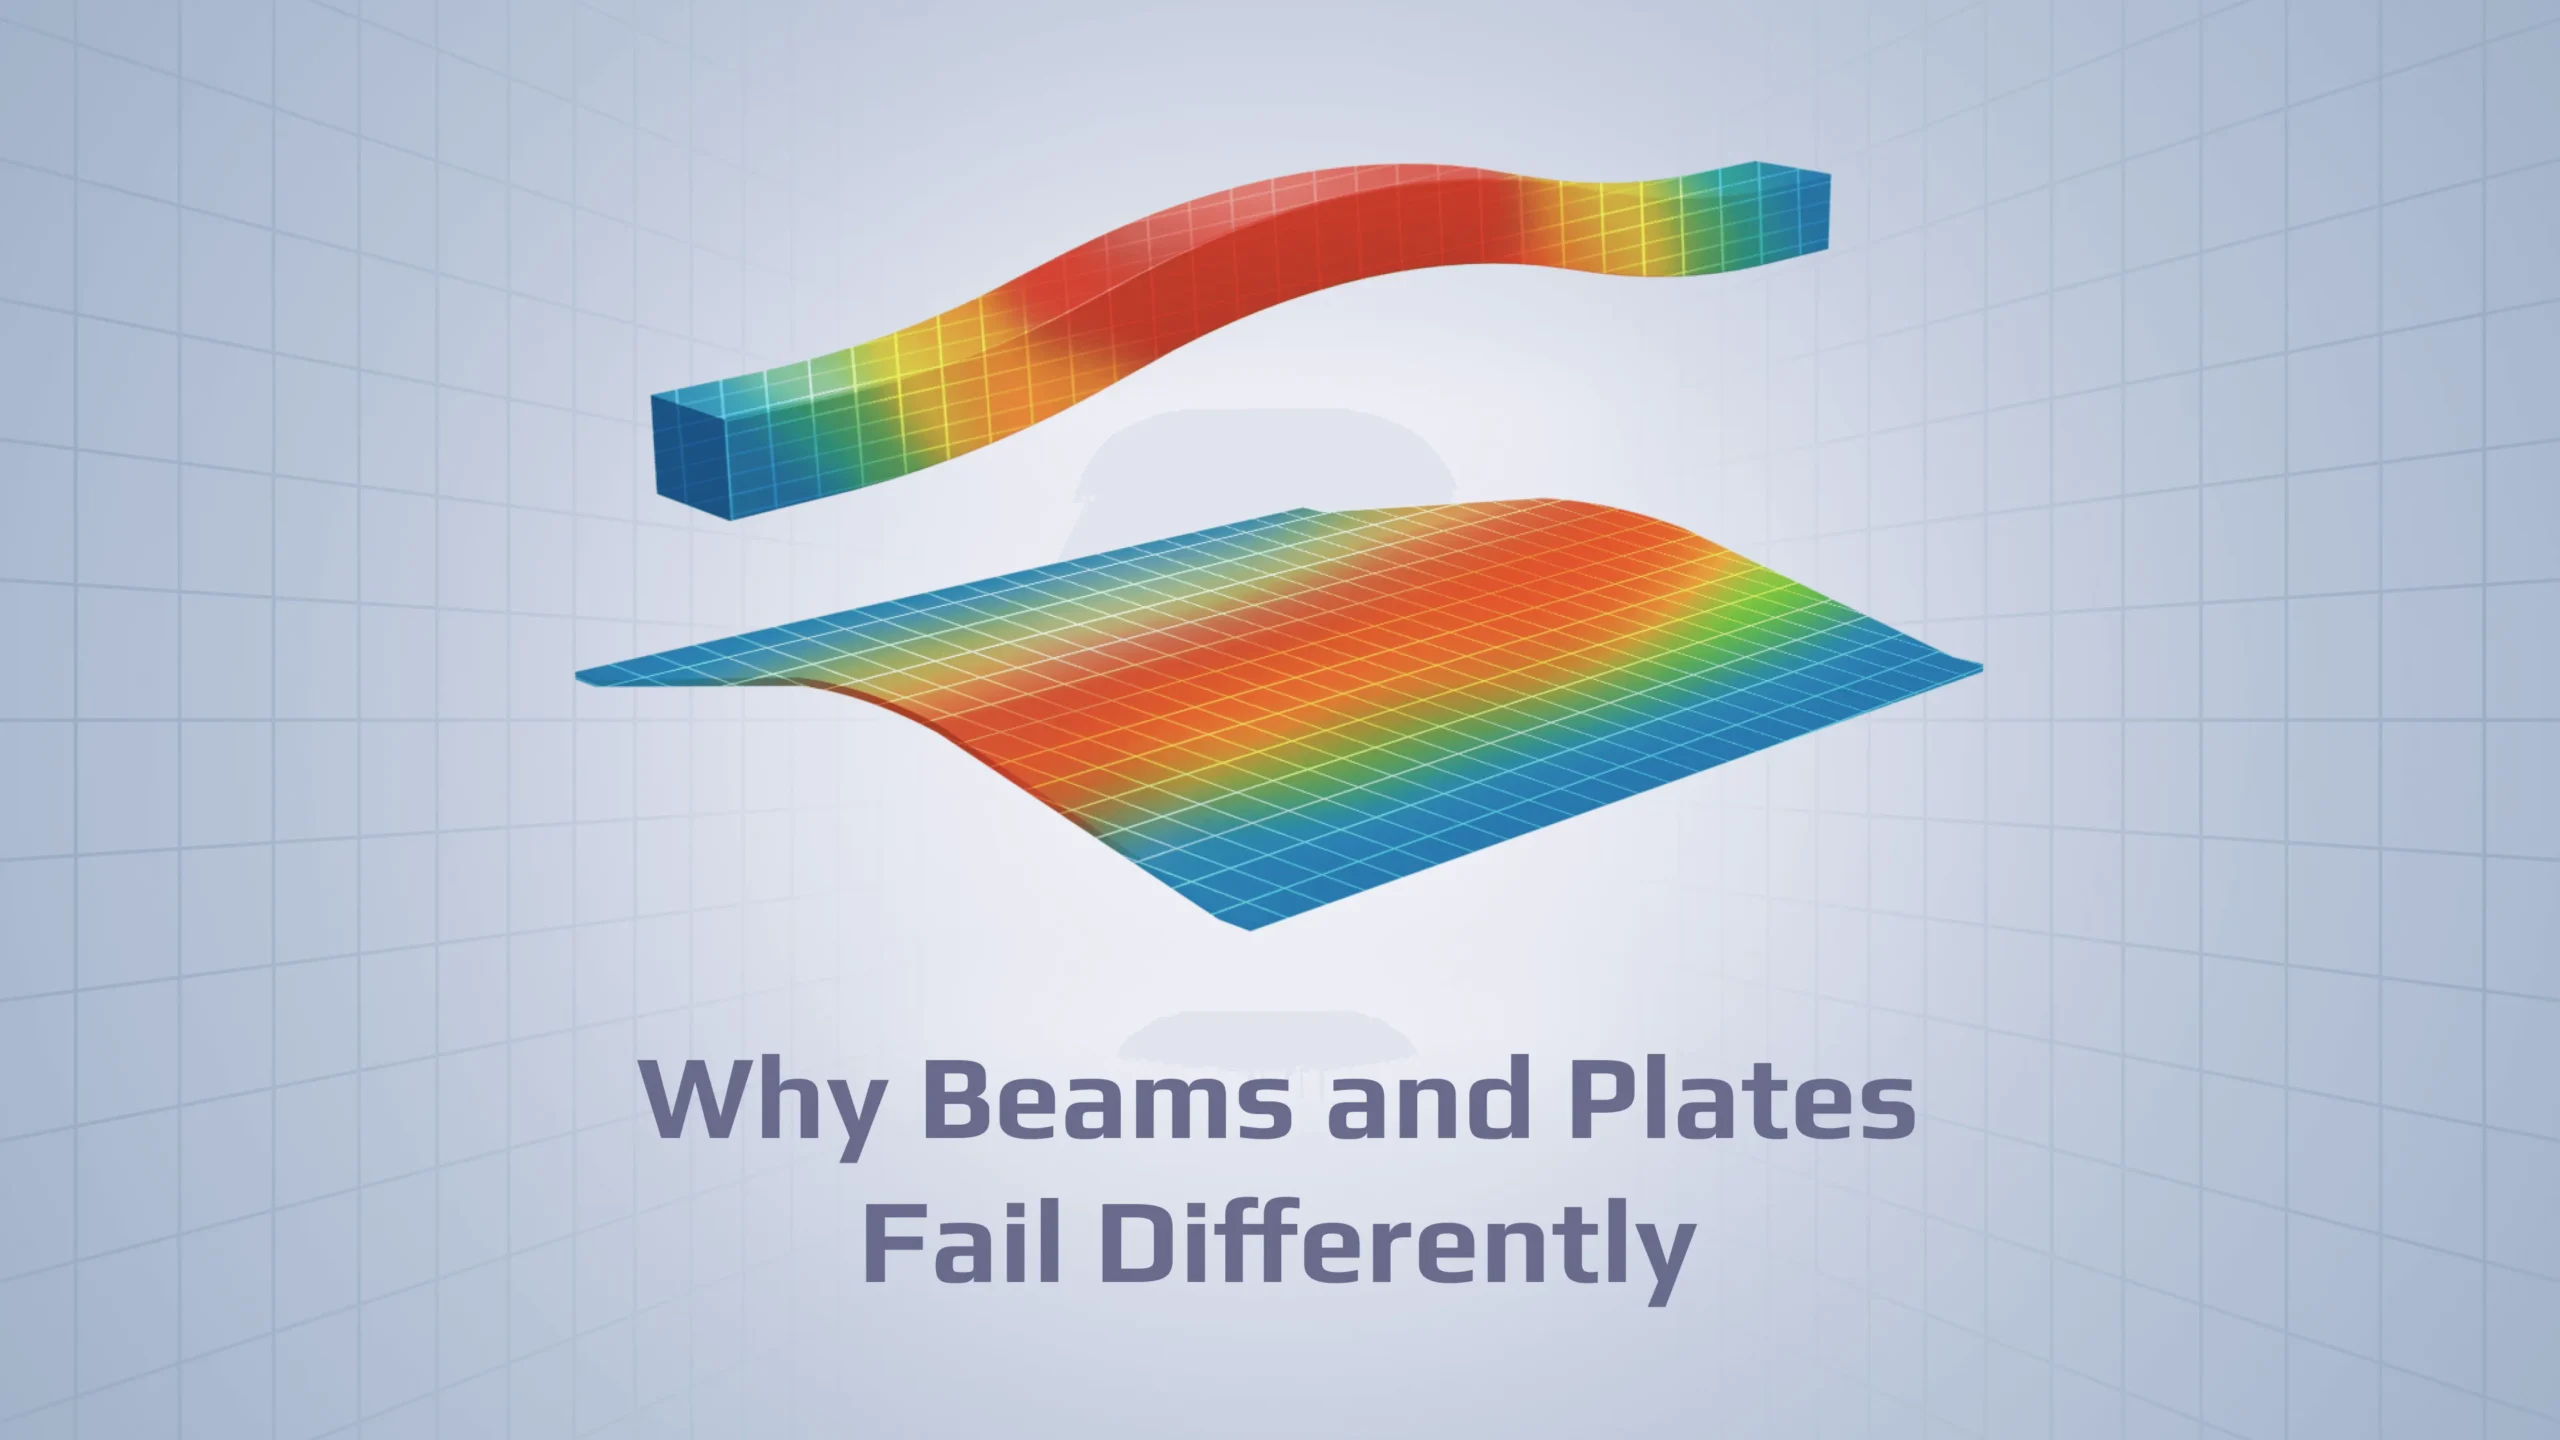
When verifying a beam model, engineers need to understand how different components, such as beams and plates, react to compressive loading. The concepts of beam buckling and plate buckling share foundational formulas but differ significantly in their critical buckling shapes, dependence on geometry, and post-buckling behavior, particularly regarding reserve capacity. That’s why, this article will guide you on the fundamental differences between how two common structural elements fail under compression: the simple beam and the more complex plate.
If you want to explore this topic deeper, please watch this lecture performed by SDC Verifier’s CEO and professor, Wouter van den Bos, on our YouTube channel:
Image: Beam and Plate Buckling
In a beam model, buckling analysis can be performed using beam elements. When analyzing beams, especially those designed as fixed boxes, the buckling length might theoretically be reduced (e.g., from center point to center point), but caution is advised in the design phase, as being slightly conservative may provide a necessary extra limit later on.
A fundamental principle of beam buckling is that the lowest buckling shape is always the most critical one. Crucially, if a beam buckles and the material surpasses the yield limit at a certain location, the structure is generally considered to collapse, meaning there is no reserve capacity.
Image: Plate buckling visualization
Plate buckling occurs when a thin section’s edges are supported, typically by other plates in the perpendicular direction. If the edges are free, the results revert to those of standard Euler beam buckling.
While plate buckling formulas utilize similar theoretical foundations to beam buckling, the behavior is significantly more complex.
Unlike beams, the lowest buckling shape in plate buckling is not always the most critical. The critical risk is determined largely by the geometry ratio of the plate:
Structural analysis software, SDC Verifier, provides engineers with powerful tools to automate the verification of beam and plate buckling according to international standards.
Also, SDC Verifier provides Beam Member and Joint Checks App for large offshore and lattice-type structures by automatically detecting beam members and calculating buckling lengths in three directions (Y, Z, and torsional), fully independent of mesh density.
All international standards (such as DNV, ABS, Lloyd’s Register, and Eurocode 3) compare the calculated Euler buckling limit (the stress at which the plate buckles) to the material’s yield stress σ_yield.
If the buckling limit and the yield limit are assumed to be equal, this defines the maximum permissible width-to-thickness ratio (B/T).
When using higher grade steels, which possess a higher yield stress, the buckling phenomenon becomes more critical. To ensure the plate can achieve that higher yield limit before buckling, a lower maximum width-to-thickness ratio is necessary.
For example, increasing the steel grade by 50% (e.g., from S235 to S360) means the designer can potentially reduce the plate thickness by 50%. But, it requires installing significantly more stiffeners (potentially 70% more), as the distance between the stiffeners must be reduced (e.g., from 56 times the thickness down to 46 times the thickness) to manage the increased buckling risk.
Image: Comparison table of edges effect on plate buckling
The way the plate edges are supported drastically changes the buckling limit.
One of the most important practical differences between plate and beam behavior is the concept of reserve capacity.
If a plate buckles at a stress level lower than its yield limit (i.e., it is a very wide plate), initial buckling occurs. However, the plate edges, which are typically connected to side plates, still retain stability and can reach the yield limit before they buckle.
This post-buckling stability is quantified using the effective width.
Modifications to the effective width curve may be necessary to account for factors like initial plate imperfections or concentrated loads, such as those from a crane wheel.
Image: Effect of load type and combination
To assess the total risk, the standards calculate the risk in each direction, σ₁ and σ₂, and the shear risk, τ, and then combine these factors.
The fundamental approach used across all major design standards is based on the idea of squaring the limits in each direction and ensuring their sum is below a certain safety threshold (often below one):
While different standards utilize varying safety factors and combination factors, the basic concept of comparing the buckling limit to the yield stress through these combined squared terms remains consistent.
Beams typically fail when the lowest buckling mode exceeds the material yield, offering little to no reserve capacity. Plates, on the other hand, can exhibit post-buckling stability, with factors such as geometry, edge conditions, and steel grade significantly influencing their behavior. Concepts like the buckling stiffness K, effective width, and combined stress criteria help engineers assess risk according to international standards.
By recognizing these nuances, engineers can design safer, more efficient structures and make informed decisions about stiffener placement, material selection, and thickness. Software, like SDC Verifier, simplifies this process by automating buckling checks, calculating effective widths, and ensuring compliance with standards, ultimately saving time and reducing the risk of human error.
Stay updated with the latest in structural verification, engineering insights, and SDC Verifier updates.