Why EN 13001 is Essential for Strength and Fatigue Verification in Cranes

Are your crane verifications keeping pace with the latest industry standards? With the advent of EN 13001, the bar for crane safety has been raised. Don’t risk falling behind – this comprehensive guide will equip you with the knowledge and tools needed to master of verification.
Understanding EN 13001’s Verification Approach
EN 13001, published in 2018, has become the governing standard for crane design and verification in Europe, superseding older standards like FEM 1.001.
They lacked the granularity to adequately address fatigue, a critical failure mode in cyclically loaded structures like cranes. Additionally, these standards often treated the crane as a monolithic entity, neglecting the individual behaviors of its various components.
EN 13001 rectifies these shortcomings by incorporating a more nuanced understanding of crane behavior. The standard recognizes that fatigue is a significant concern and provides a comprehensive framework for assessing fatigue life under various load scenarios. This includes detailed guidelines for classifying welds, accounting for stress concentrations, and applying appropriate S-N curves for fatigue calculations.
Furthermore, EN 13001 encourages the use of FEA-based calculations. This allows engineers to model complex crane structures with greater accuracy, capturing stress distributions and identifying potential fatigue hotspots that may not be apparent in simplified calculations.
Load Combinations
EN 13001 defines three primary load combinations to account for the diverse loading scenarios a crane may experience:
- Regular: Frequent conditions during normal operation (hoisting, slewing) with partial safety and dynamic factors for uncertainties and inertial effects.
- Occasional: Less frequent but plausible events (extreme weather, maintenance) with adjusted safety and dynamic factors reflecting lower occurrence probability.
- Exceptional: Rare events with severe consequences (seismic events, collisions, emergency braking) with lowest safety factors but potentially higher dynamic factors for sudden impacts.
Table 12a in EN 13001, illustrated below, details the load combinations and associated partial safety factors that must be considered for crane verification.
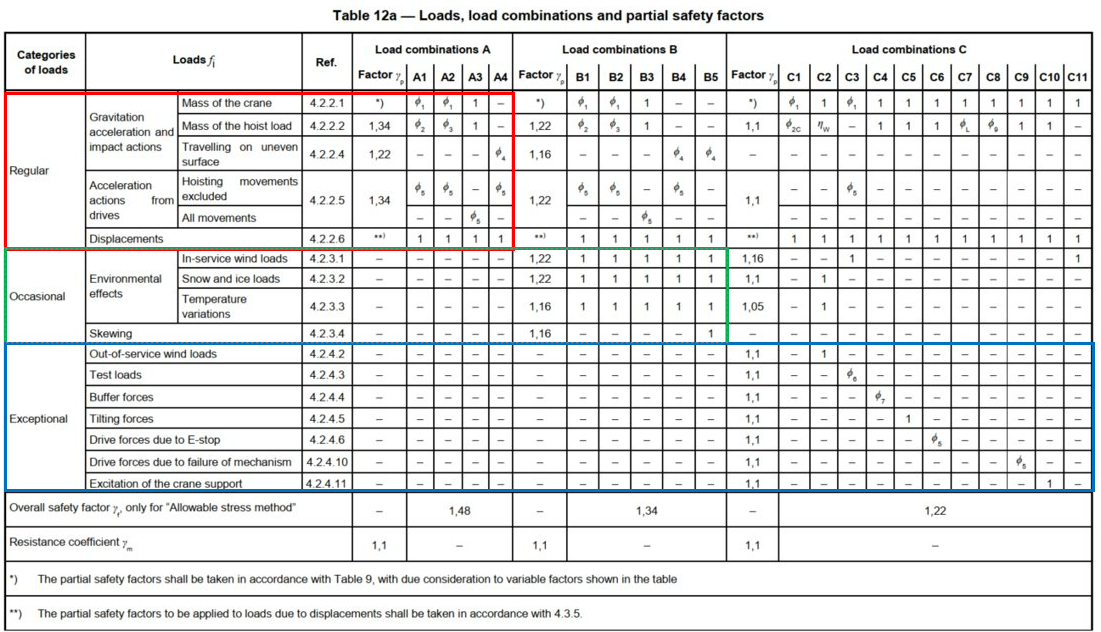
Table 12a: Loads, load combinations, and partial safety factors as specified in EN 13001.
The inclusion of partial safety and dynamic factors in load combinations is a fundamental aspect of EN 13001’s safety philosophy. Partial safety factors provide a margin of safety by amplifying the calculated loads, ensuring that the crane’s design can withstand unforeseen variations and uncertainties. Dynamic factors account for the inertial forces generated during crane movements, which can significantly impact the stresses on structural components.
By considering these diverse load combinations and incorporating appropriate safety factors, EN 13001 provides a comprehensive framework for assessing a crane’s structural integrity under a wide range of operational conditions.
Dynamic Factors
Dynamic factors in EN 13001 address the transient loads and inertial effects induced by crane movements and lifting operations, varying depending on the specific movement, its speed, and the crane’s structural characteristics. For instance, during hoisting and slewing, the dynamic factor accounts for the acceleration and deceleration of the load and superstructure, along with any swinging or pendulum motions and centrifugal forces. These factors are typically expressed as a multiplier applied to the static load, resulting in a dynamic equivalent load that accounts for the inertial effects.
EN 13001 provides detailed guidelines for calculating dynamic factors, ensuring that crane verifications consider the full spectrum of loading conditions, including the transient effects of crane movements.
Partial Safety Factors
Partial safety factors (PSFs) are applied to both loads and material properties in EN 13001, providing a margin of safety that accounts for potential variations, inaccuracies, and unforeseen events.
For loads, PSFs amplify the calculated loads to ensure the crane’s design can withstand higher than anticipated forces due to factors like wind gusts, uneven load distribution, or operator errors.
For material properties, PSFs account for variability in material strength, stiffness, and other mechanical characteristics due to manufacturing processes, environmental conditions, and material degradation. They are applied as divisors to the characteristic material strengths, ensuring conservative estimates in design calculations.
The magnitude of PSFs varies depending on the specific load or material property, as well as the desired level of safety.
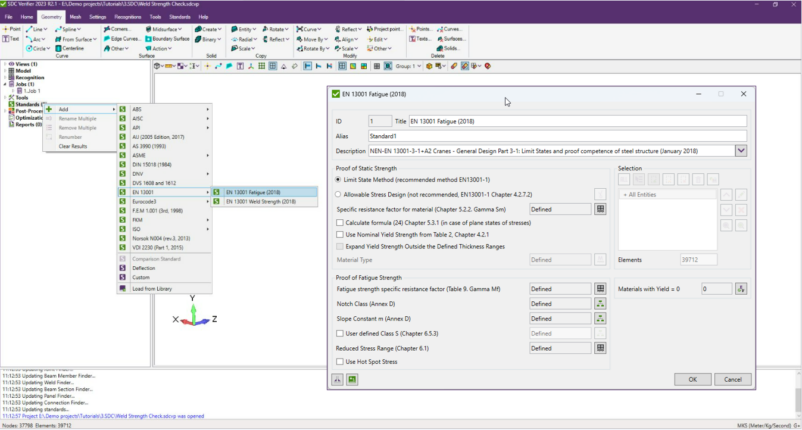
SDC Verifier streamlines the implementation of EN 13001 by incorporating its requirements directly into the verification process, allowing users to select verification methods, calculate or define partial safety factors, and account for material properties within a user-friendly interface, as shown below.


EN 13001 verification options in SDC Verifier, including selection of verification methods, calculation or definition of partial safety and resistance factors, and consideration of various material properties.
Structural Analysis and Load Scenarios
By discretizing the crane structure into a mesh of smaller elements, FEA can accurately capture stress concentrations and fatigue hotspots that may not be apparent in simpler models. These critical areas often occur at geometric discontinuities, weld toes, or bolted connections.
FEA also enables engineers to simulate the crane’s response under dynamic loads generated by crane movements, which is crucial for fatigue assessment. This allows for the calculation of stress ranges and the identification of potential fatigue hotspots based on actual operational conditions.
EN 13001 provides guidelines for FEA modeling, emphasizing the importance of using appropriate mesh refinements in critical areas and validating the model against experimental data where possible.
Read More: Residual Life Analyses for Crane Structures: How to Avoid Cracks and Crane Fatigue
Load Case Considerations
The trolley and grab significantly influence the stress distribution within the crane structure. Their movement along the crane induces varying load patterns and stress cycles, potentially leading to fatigue damage.
For instance, the trolley’s position affects bending moments and shear forces on the bridge girder, while the grab’s position and load influence stresses on the hoisting ropes, boom, and supporting structures.
Therefore, it is essential to consider a range of trolley and grab positions that reflect actual operational conditions to assess a crane’s fatigue life accurately. This may involve analyzing multiple load cases with varying trolley and grab locations, load magnitudes, and lifting scenarios.
EN 13001 provides guidelines for selecting appropriate load cases, emphasizing the need to consider the most critical combinations that induce the highest stress ranges and fatigue damage accumulation. This may involve using historical operational data, analyzing typical load cycles, or performing parametric studies.
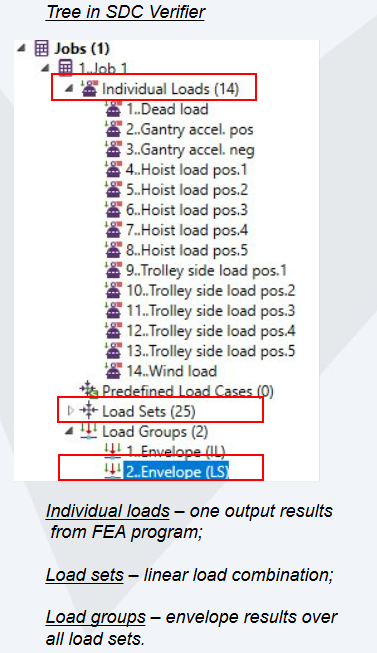
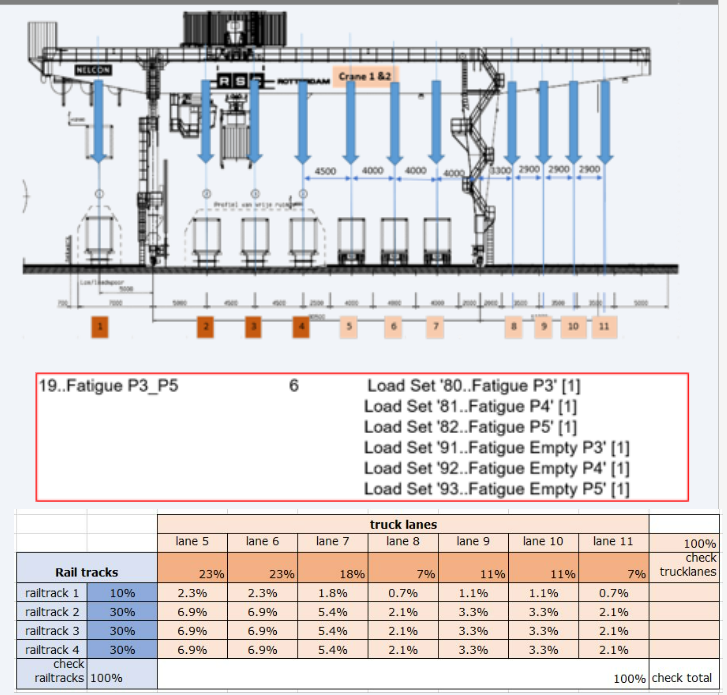
As illustrated below, the distribution of fatigue load sets along a crane’s structure is crucial in the verification process, depending on trolley and grab positions and specific operational requirements. SDC Verifier facilitates the management and organization of load combinations, as shown in Figure X, which illustrates the tree structure of loads in the software.
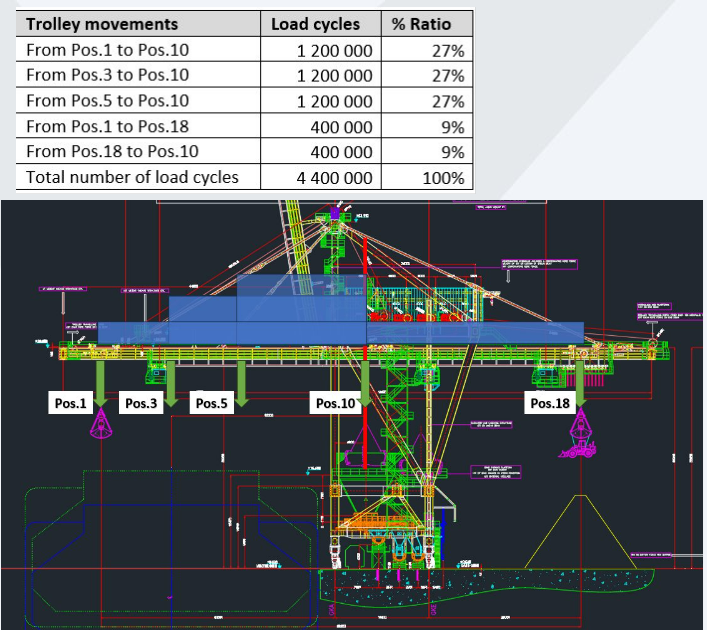
Illustration of the importance of considering various trolley movements and their corresponding load cycles in a crane’s fatigue analysis, along with the tree structure of loads in SDC Verifier, showcasing the different types of loads considered in crane verification and their organization into individual loads, load sets, and load groups.
Cycle Counting
Cycle counting is the process of identifying and quantifying the number of stress cycles a crane component undergoes during operation. Each stress cycle consists of peak and trough stresses, representing the maximum and minimum stresses experienced during a load cycle. The magnitude and frequency of these stress cycles are key factors in determining fatigue damage.
Various cycle counting methods exist, from simplified approaches based on operational data to sophisticated techniques like rainflow counting, which accurately identify and quantify complex stress histories. The choice depends on available data, desired accuracy, and EN 13001 requirements.
Once identified and quantified, stress cycles, along with appropriate S-N curves (stress vs. number of cycles to failure), can estimate the accumulated fatigue damage. S-N curves, typically obtained from experimental data, represent the relationship between stress amplitude and fatigue life for a given material and geometry.
By applying cycle counting and S-N curve analysis, engineers can assess cumulative fatigue damage on crane components and predict their remaining fatigue life.
Weld Classifications and Fatigue Assessment
Welds are susceptible to fatigue failure due to stress concentrations and potential defects, often making them the weakest points in a structure.
Accurate weld classification is crucial for assigning appropriate strength values in fatigue calculations. EN 13001 provides detailed guidelines for weld classification based on factors like weld type, quality, location, and orientation.
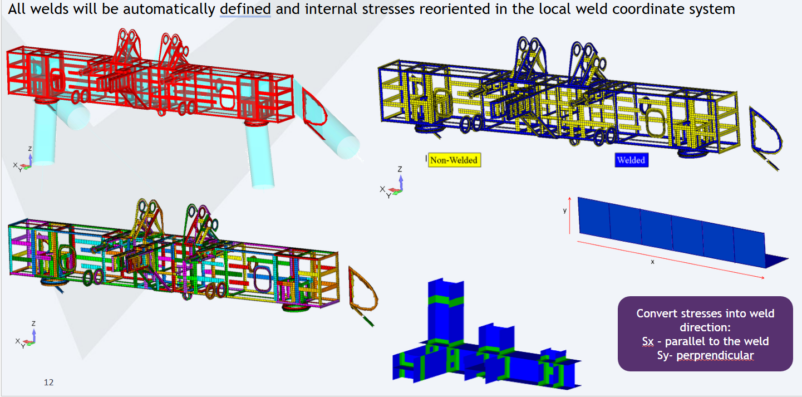
SDC Verifier streamlines this process by automatically assigning weld classifications based on user-defined criteria, ensuring consistency and reducing the risk of human error. Once classified, engineers can assign weld strengths and assess fatigue resistance using appropriate S-N curves.
Weld Strength Assigning
Weld strength is not a fixed value but varies depending on weld quality, direction, and location.
- Weld Quality: EN 13001 classifies welds into different quality categories, each with its own strength values. Higher quality welds, subject to more rigorous inspection and testing, are typically assigned higher strengths.
- Weld Direction: Welds loaded parallel to their longitudinal axis generally have higher fatigue strength than those loaded perpendicularly, as parallel loading primarily induces shear stresses, while perpendicular loading induces both shear and normal stresses, leading to higher stress concentrations.
- Weld Location: Welds in areas of high stress concentration (e.g., intersections or corners) are more susceptible to fatigue failure than those in less critical locations.
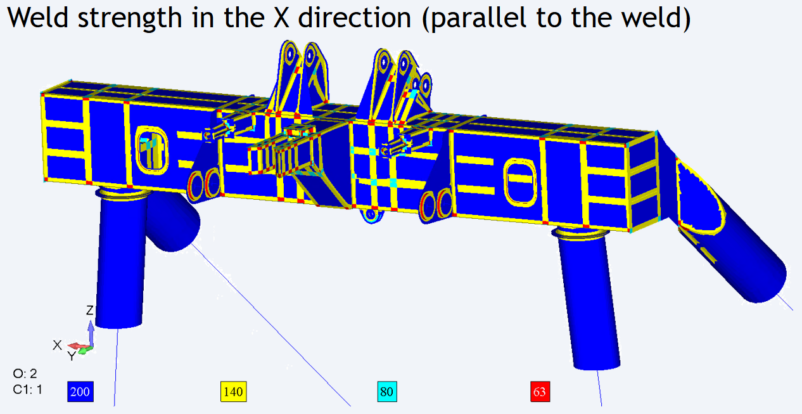
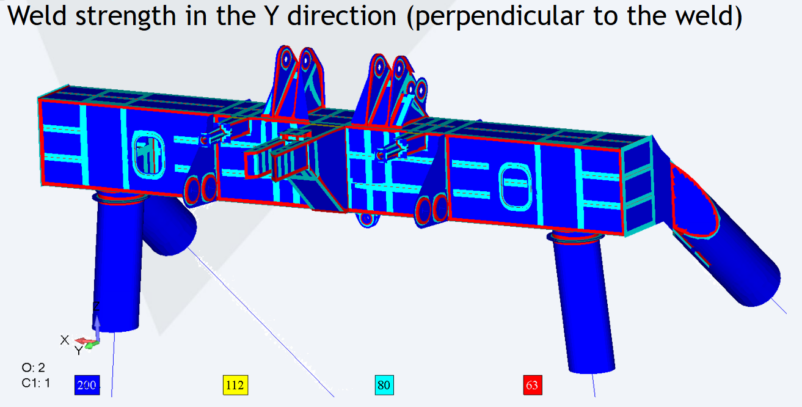
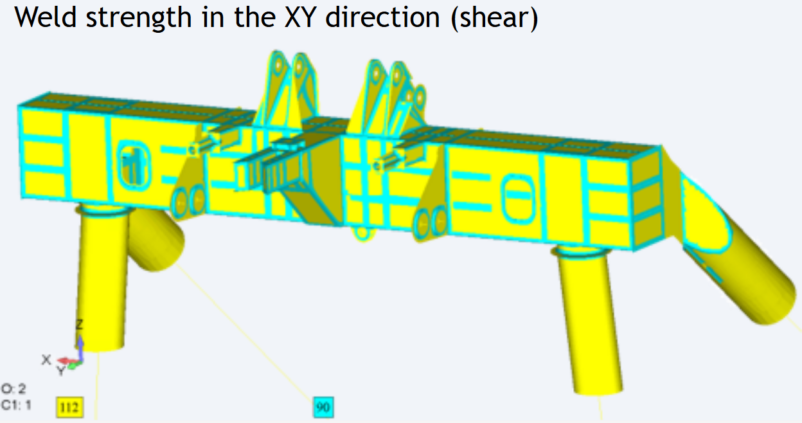
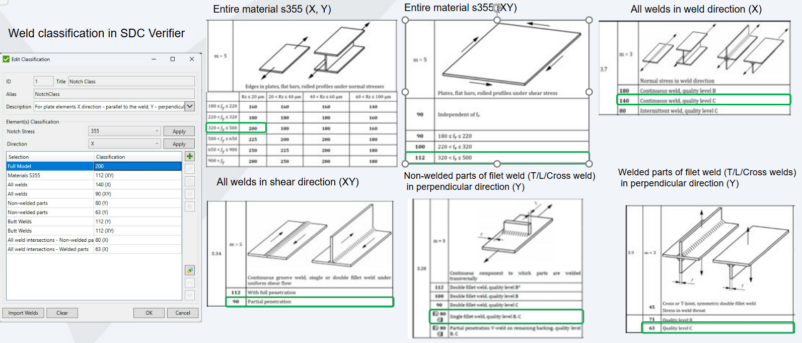
Figures above illustrate the variation of weld strength in different directions (X, Y, and shear) across a crane structure, emphasizing the need for accurate weld classification and strength assignment for fatigue assessment.
Weld classification in SDC Verifier for EN 13001, allowing users to define different weld classes for various weld types and their parts.
Notch Classes and Stress Concentrations
Notches in welded joints, such as weld toes and intersections, significantly influence fatigue life in crane structures. These geometric discontinuities amplify local stresses, accelerating fatigue crack initiation and propagation.
To account for this, EN 13001 employs notch classes, categorizing notches based on their severity, with higher classes representing more severe stress concentrations. The standard provides a list of notch classes and corresponding fatigue strength reduction factors (FSRFs).
Notch classification depends on its geometry, including radius, depth, and angle. For example, a sharp weld toe with a small radius and deep penetration would be assigned a higher class than a smooth weld toe with a larger radius. Similarly, weld intersections are typically assigned higher classes due to complex stress fields.
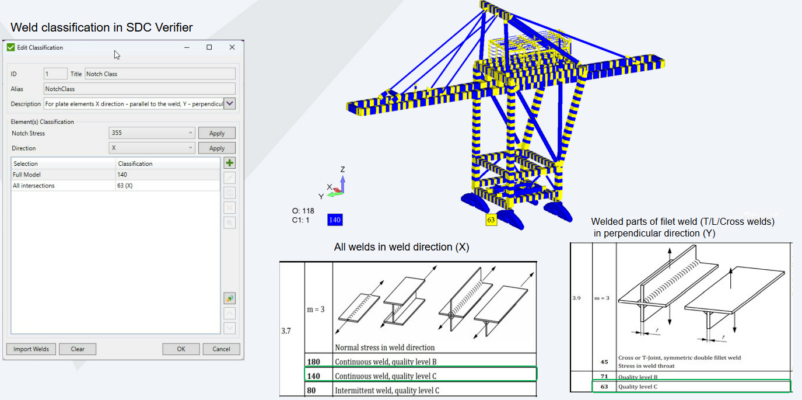
SDC Verifier automates notch identification and classification based on the FEA model geometry, applying appropriate FSRFs to calculated stresses, ensuring accurate fatigue assessment. The software’s visual representation of the crane structure, with highlighted welds and their classifications, as shown in figure, facilitates the weld classification process and ensures adherence to EN 13001 requirements.
Fatigue Calculations
Fatigue calculations in EN 13001, based on the Palmgren-Miner linear damage hypothesis, involve the following steps:
- Stress Range Determination: Calculate the stress range (Δσ) for each load case and weld as the difference between maximum and minimum principal stresses at the weld toe or root.
- S-N Curve Selection: Choose an appropriate S-N curve based on weld classification, material, and environmental conditions. EN 13001 provides a library of S-N curves.
- Damage Calculation: For each stress range (Δσ) and corresponding number of cycles (n), calculate fatigue damage (D) using D = n/N, where N is the number of cycles to failure from the S-N curve.
- Cumulative Damage: Calculate the cumulative fatigue damage (D_total) for a weld by summing damage contributions from all stress ranges: D_total = Σ D.
- Fatigue Life Assessment: Compare cumulative damage to a predefined threshold. If D_total exceeds the threshold, the weld is considered to have reached its fatigue life.
These calculations are iterative, as stress ranges and cycle numbers vary with load case and weld location. SDC Verifier automates these calculations, enabling efficient fatigue life assessment of numerous welds under various load scenarios.
Pylon Head Analysis: A Case Study
A case study of a large gantry crane’s pylon head illustrates the practical implications of EN 13001’s verification approach and the importance of detailed FEA modeling. Initial analysis using a simplified beam model indicated acceptable stresses under prescribed loads. However, closer inspection revealed localized stress concentrations near the pylon head-to-boom connection, a critical area prone to fatigue failure.
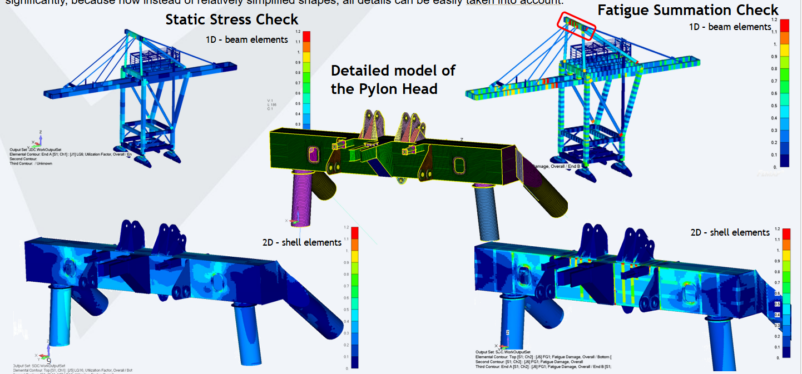
A refined FEA model using plate elements was created to accurately capture the geometric complexities and stress flow patterns. This model revealed significantly higher stresses at the weld toes and intersections than the beam model, highlighting potential fatigue hotspots. The refined analysis also emphasized the importance of considering different trolley positions in fatigue assessment, as stress distribution varied significantly with trolley movement.
Based on these findings, design modifications were implemented to reduce stress concentrations and improve fatigue life:
- Weld Toe Grinding: Smoother weld toe profiles to reduce stress concentration and increase fatigue strength.
- Reinforcement Plates: Added to distribute stresses more evenly and reduce peak stresses.
- Stress Relieving: Post-weld heat treatment to relieve residual stresses and enhance fatigue life.
Using specialized software like SDC Verifier, the pylon head welds were automatically recognized and classified (Figure X), demonstrating the software’s capability in facilitating detailed analysis and ensuring accurate fatigue assessment.
Beam vs. Plate Model Comparison
The choice between beam and plate models in crane verification involves a trade-off between computational efficiency and accuracy.
Beam models, representing members as one-dimensional elements, are computationally less demanding and provide insights into overall structural behavior. They are useful for initial assessments and preliminary design iterations, focusing on global load distribution and identifying potential concerns.
However, beam models are limited in capturing localized stress concentrations and complex stress flow patterns. In critical areas like weld toes, intersections, and geometric discontinuities, their assumptions may not hold, leading to inaccurate stress predictions and underestimation of fatigue damage.
Plate models, discretizing geometry into two-dimensional plate elements, offer a more refined representation. They can capture stress variations across thickness and along member edges, crucial for assessing stress concentrations and fatigue hotspots.

Comparing results using 1D beam elements and 2D shell elements. The detailed model (shell elements) reveals localized stresses not captured by the beam model.
While more accurate, plate models also have increased computational cost and complexity. The finer mesh resolution for accurate stress analysis can lead to longer solution times. Therefore, a balanced approach is often adopted, using beam models for initial assessments and plate models for detailed analysis of critical areas.
The pylon head case study exemplifies this. The initial beam model provided valuable insights, but failed to capture localized stresses at the connection. The subsequent plate model analysis revealed the true extent of the stress concentrations, leading to design modifications that improved fatigue life.
In conclusion, both models have their place. Beam models offer efficiency for initial assessments, while plate models provide greater accuracy for detailed analysis of critical areas.


