Benchmark Comparison: DNV RP-C203 Fatigue (2016) vs (2024)

This benchmark evaluates the differences between the 2016 and 2024 versions of the DNV RP-C203 standard for fatigue resistance analysis. Using a test model composed of welded plates and meshed with shell elements, the fatigue life predictions were compared under identical loading conditions. The assessment includes both SN Curve C and SN Curve B1 classifications to analyze how updates to the standard affect fatigue results, damage estimations, and critical stress parameters. All comparisons were carried out using SDC Verifier with consistent model setups and input parameters.
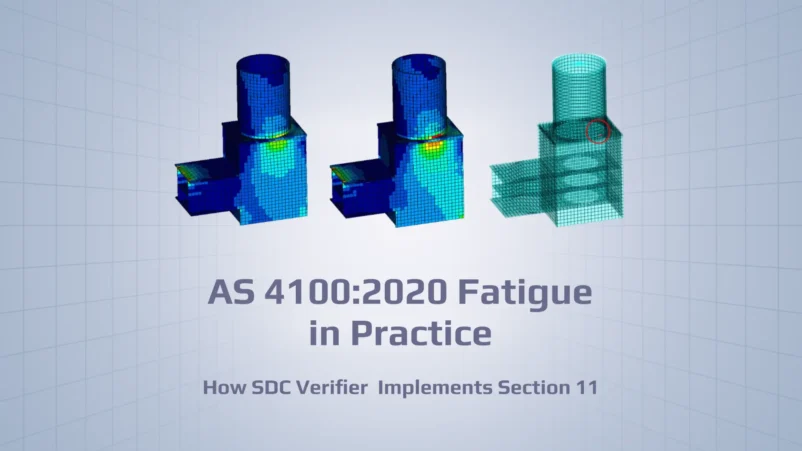
The test model consists of two plates welded in such a way that the vertical plate is positioned at the center of the horizontal one. The model was meshed using shell elements.
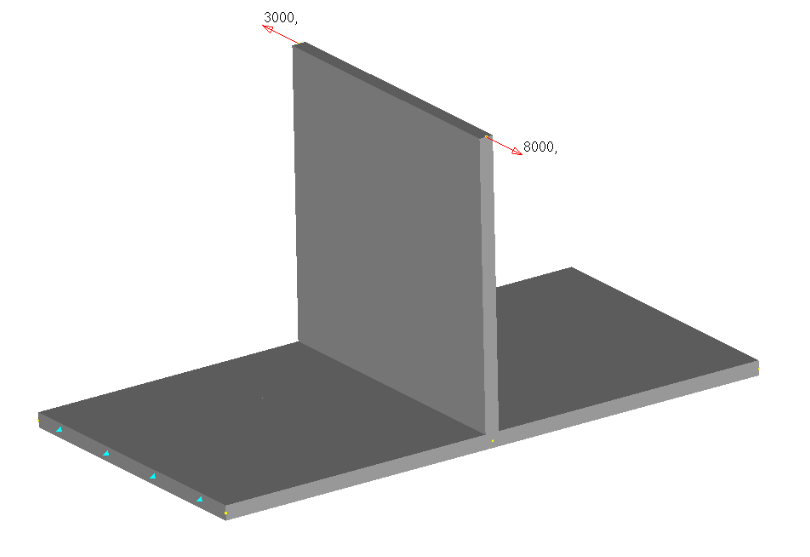
Vertical Plate Dimensions:
-
Thickness: 10 mm
-
Width: 200 mm
-
Height: 200 mm
Horizontal Plate Dimensions:
-
Thickness: 10 mm
-
Width: 400 mm
-
Height: 200 mm
Weld Parameters:
-
Double fillet weld
The model is constrained along the two shorter edges of the horizontal plate.
Two loads are applied at points located in the middle of the thickness on the top surface of the vertical plate. The loads are applied in such a way that they are parallel to the surfaces of both plates, but in opposite directions.
Loads:
- 8 kN in the positive Z-direction of the global coordinate system
- 3 kN in the negative Z-direction of the global coordinate system
A fatigue group was created using these two loads, with the number of cycles set to 200,000.
The comparison of outcomes was performed by adding two standards in SDC Verifier:
- DNV RP-C203 Fatigue (2016)
- DNV RP-C203 Fatigue (2024)
Compared Parameters:
- Delta_stress (Δσ): as defined in Method B (4.3.4)
- Nfailure: number of cycles to failure
- Fd_Summed: summed fatigue damage
- Fd_root: estimation of stress overshoot
Standards Input Settings (applied to the full model):
- SN Curve: C (according to Table A-3: continuous weld essentially parallel to the direction of applied stress)
- Environment: Air
- Reference Thickness: None
- Use Stress Factor 1.12 for Method B: Yes
In each case, the element with the highest Delta_stress was identified, as the worst-case outcomes are considered.
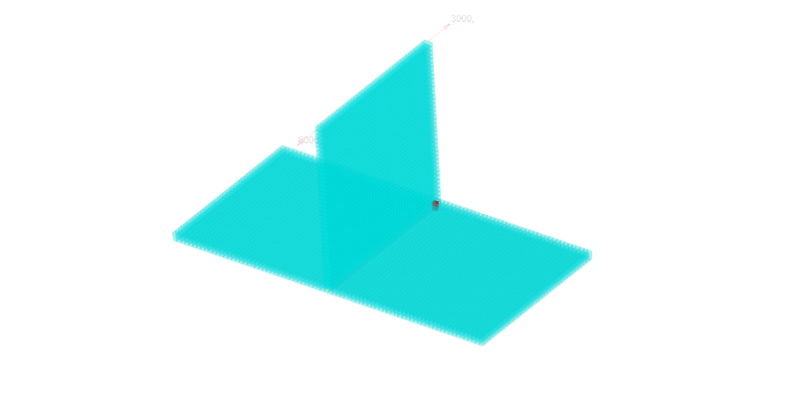
DNV RP-C203 Fatigue (2016):
Results:
- Delta_stress: 492.17 MPa
- Nfailure: 32,764.49
- Fd_Summed: 6.10
- Fd_root_3: 1.83
(Fd_root_3 is used as the m factor in the element was calculated as 3)

DNV RP-C203 Fatigue (2024):
Results:
- Delta_stress: 492.17 MPa
- Nfailure: 16,513.30
- Fd_Summed: 12.11
- Fd_root_3_5: 2.04
(Fd_root_3_5 is used as the m factor in the element was calculated as 3.5)

The new version, DNV RP-C203 Fatigue (2024), allows for fewer cycles until failure than the older version when considering SN Curve C.
Considering the situation where the model was classified with SN Curve B1:
DNV RP-C203 Fatigue (2016):
Results:
- Delta_stress: 492.17 MPa
- Nfailure: 22,309.53
- Fd_Summed: 8.96
- Fd_root_4: 1.73
(Fd_root_4 is used as the m factor in the element was calculated as 4)

DNV RP-C203 Fatigue (2024):
Results:
- Delta_stress: 492.17 MPa
- Nfailure: 22,309.89
- Fd_Summed: 8.96
- Fd_root_4: 1.73
(Fd_root_4 is used as the m factor in the element was calculated as 4)

Both versions allow for the same number of cycles to failure when the model is classified with SN Curve B1. However, under the same Delta_stress, DNV RP-C203 Fatigue (2016) allows for more cycles to failure when the model is classified with SN Curve C than with SN Curve B1—which theoretically should represent a stronger classification. In the newer DNV RP-C203 Fatigue (2024), this inconsistency is no longer present.
These results were expected due to the different behavior of the S-N curves across the two versions of the standard. In the 2016 version, the figure shows that some of the “lower” grade curves intersect those of the “higher” ones in regions corresponding to relatively low cycle counts.
| DNV RP-C203 (2016) | DNV RP-C203 (2024) | DNV RP-C203 (2016) | DNV RP-C203 (2024) | |
|---|---|---|---|---|
| SN Curve | C | C | B1 | B1 |
| Delta_stress | 492.17 MPa | 492.17 MPa | 492.17 MPa | 492.17 MPa |
| Nfailure | 32,764.49 | 16,513.30 | 22,309.53 | 22,309.89 |
| Fd_Summed | 6.10 | 12.11 | 8.96 | 8.96 |
| Fd_root (for relevant m) | 1.83 (m = 3) | 2.04 (m = 3.5) | 1.73 (m = 4) | 1.73 (m = 4) |
Conclusion
The comparison shows that under SN Curve C, the 2024 version predicts significantly fewer cycles to failure than the 2016 version, despite identical stress levels — highlighting the updated standard’s more conservative behavior. This difference is attributed to the revised shape and slope of the S-N curves in the 2024 release, which removes inconsistencies such as lower-grade curves outperforming higher ones under certain conditions.
In contrast, both versions yield nearly identical results when the model is classified with SN Curve B1, confirming alignment under specific configurations.
These findings emphasize the importance of understanding curve behavior and version-specific fatigue assumptions, especially when updating design procedures or comparing historical analysis with current standards.
