How to Simplify DNV RP-C203 Compliance in Offshore Structures

DNV RP-C203 compliance doesn’t have to be a bottleneck in offshore project timeline. SDC Verifier offers a proven solution, trusted by leading engineering firms, to streamline fatigue design process from start to finish.
Overview of DNV RP-C203
DNV RP-C203, the “Recommended Practice for Fatigue Design of Offshore Steel Structures,” stands overarching objective is to ensure the structural integrity and operational safety of these assets by mitigating the risk of fatigue failure.
Fatigue, the gradual weakening of a material due to cyclic loading, is a pervasive in the offshore domain. DNV RP-C203 provides a comprehensive framework for assessing and managing this risk. The standard outlines a series of methodologies and criteria for:
- Evaluating the stresses induced in structural components under various loading conditions.
- Applying appropriate fatigue strength curves (S-N curves) based on material properties, weld types, and environmental factors.
- Determining the expected fatigue life of structural components using established methods such as Miner’s rule.
- Incorporating safety factors to account for uncertainties and ensure a high level of reliability.
The standard also defines the Fatigue Limit State (FLS), which ensures that structures are designed to resist cyclic loading over their service life with an acceptable level of reliability. This is achieved by ensuring that the accumulated fatigue damage (D) is less than or equal to the fatigue capacity utilization factor (η), which is the inverse of the Design Fatigue Factor (DFF).
The standard promotes a proactive approach to fatigue management, enabling the identification and mitigation of potential fatigue hotspots before they escalate into critical failures.
Сritical Factors in Fatigue Design
Several critical factors play a pivotal role in fatigue design as outlined in DNV RP-C203:
- Environmental Conditions (Air vs. Seawater)
The corrosive nature of seawater significantly accelerates fatigue crack growth compared to air. DNV RP-C203 (2016) accounts for this by providing different S-N curves for air (chapter 2.4.4) and seawater with cathodic protection (chapter 2.4.5) environments.
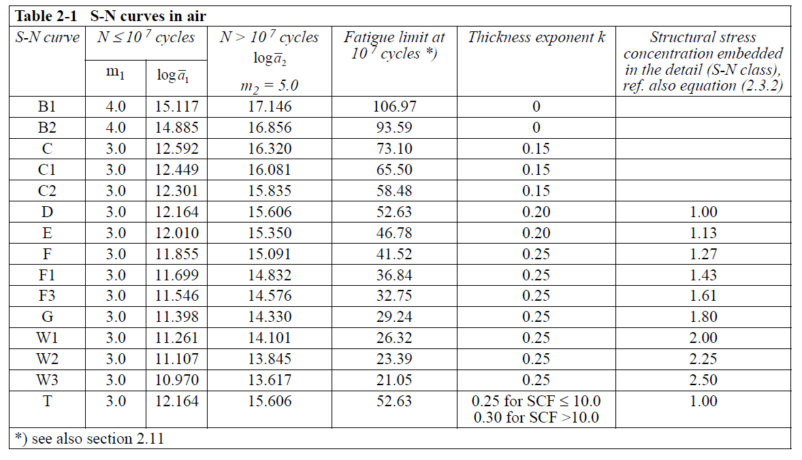
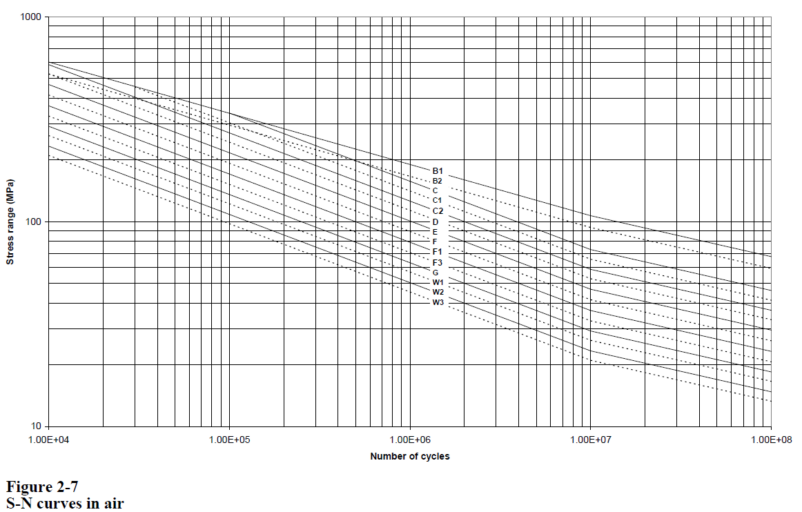
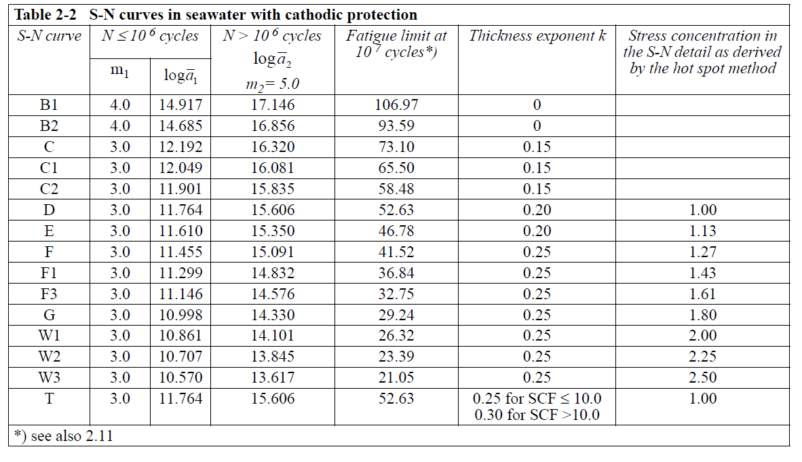
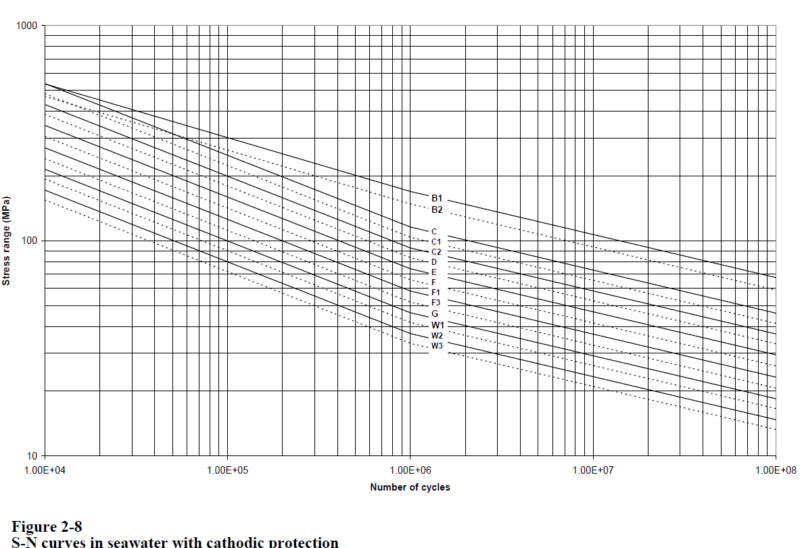
Image from practice DNV-RP-C203 Fatigue design of offshore steel structures
- Stress Calculation Methods (Focus on Method B)
DNV RP-C203 (2016) offers various methods for stress calculation, with Method B (chapter 4.3.4) being particularly relevant for shell element models.
This method involves extracting stresses at a specified distance of 0.5t from the weld toe or intersection line (if no weld is modeled), effectively capturing the stress concentration at these critical locations. The effective hot spot stress range is then calculated as:
Δσ_hs = 1.12 * max[σ_prin,max - σ_prin,min]
where σ_prin,max and σ_prin,min are the maximum and minimum principal stresses, respectively.
- S-N Curves and Material Properties
The fatigue strength of a material is characterized by its S-N curve, which relates stress range to the number of cycles to failure. DNV RP-C203 provides a comprehensive set of S-N curves for different materials, weld types, and load directions (X – parallel, Y – perpendicular to the weld), enabling accurate fatigue life prediction. For weld intersections, the lowest class between X and Y directions is used, as per Table F-1 from DNV RP-C203.
- Thickness Considerations
The thickness of a structural component influences its fatigue strength. DNV RP-C203 incorporates a thickness correction factor (TF) into the S-N curves, calculated as:
TF = (t / t_ref)^K
where t is the actual thickness, t_ref is the reference thickness (25mm for welded connections, 16mm for tubular joints, 25mm for bolts), and K is the thickness exponent on fatigue strength, as given in Tables 2-1 to 2-4 of the standard.
Additionally, DNV RP-C203 introduces Design Fatigue Factors (DFFs), which are used to adjust the allowable fatigue damage based on the consequence of failure and the desired level of conservatism. Higher DFFs are typically applied to critical components where failure could have severe consequences.
Challenges in Manual Calculation
Fatigue assessments are often squeezed in at the end of projects due to data limitations, leading to oversimplified analyses that may result in overweight designs or the omission of critical load cases.
- The complexity of the calculations, coupled with the sheer volume of data involved, leaves room for human error. Misinterpreting stress values, incorrectly applying S-N curves, or making mistakes in thickness corrections can lead to inaccurate fatigue life predictions and potentially unsafe designs.
- DNV RP-C203 calculations require a deep understanding of fatigue principles, material behavior, and the intricacies of the standard itself. This necessitates specialized expertise, which may not always be readily available within a project team, leading to delays or the need for external consultants.
- Manual calculation of fatigue life for complex offshore structures can be an incredibly time-consuming endeavor. Extracting stresses from FEA results, identifying hotspots, applying S-N curves, and performing cumulative damage calculations for numerous load cases can quickly become a bottleneck in the design process.
- In finite element models, the necessary information for S-N curve classification (weld type, geometry, stress direction) is often missing, making the manual classification process time-consuming and prone to errors.
Read More: How to Set Classification for DNV RP-C203
These challenges collectively underscore the need for a more efficient and reliable approach to DNV RP-C203 compliance.
6 Ways SDC Verifier Can Help You Achieve DNV RP-C203 Compliance Faster (and Easier)
SDC Verifier simplifies the process of applying DNV RP-C203 by directly incorporating the standard’s parameters into the software interface.
As shown in Figure 1, users can easily define the environmental conditions (air or seawater), reference thickness, and S-N curves according to the standard.

Figure 1: SDC Verifier interface showing settings for DNV RP-C203 fatigue analysis.
The software also allows for the automatic application of the stress factor 1.12 for Method B stress calculations, streamlining the fatigue assessment process.
Did you know that SDC Verifier recognizing critical elements automatically can save time and reduce errors? Learn more in Recognition Tools.
1. Stress Analysis
Seamlessly generate stress results from your FEA model, or import stress results from your finite element analysis software (e.g., ANSYS, Abaqus, Nastran) eliminating the need for manual data extraction and reducing the risk of errors.
The accuracy of this initial stress analysis is paramount for reliable fatigue life prediction. A well-defined FEM mesh with appropriate density is crucial for capturing stress gradients accurately, particularly in complex regions.
2. Hotspot Identification and Stress Linearization
Automatically identifies critical hotspots based on stress concentration factors (SCFs) and linearizes stresses according to DNV RP-C203 Method B (Chapter 4.3.4), ensuring compliance with the standard’s requirements.
In line with best practices, SDC Verifier allows for the use of solid submodels in these critical areas where stress distribution is highly localized, further enhancing accuracy.
This aligns with the standard’s recommendation to extract hot spot stress at 0.5t away from the weld toe in 3D models with welds, or 0.5t away from the intersection line in shell models without welds.
3. S-N Curve Application
Employs a comprehensive database of DNV-compliant S-N curves, automatically selecting the appropriate curve based on material properties, weld details, and environmental conditions, and the principal stress angle relative to the weld. This approach ensures that the most accurate S-N curve is used for each specific scenario, as per DNV RP-C203 guidelines. Table F-1 from the standard, shown in Figure 4, illustrates how the S-N curve classification is determined based on the principal stress angle and the joint classification in the stress direction normal to the weld.
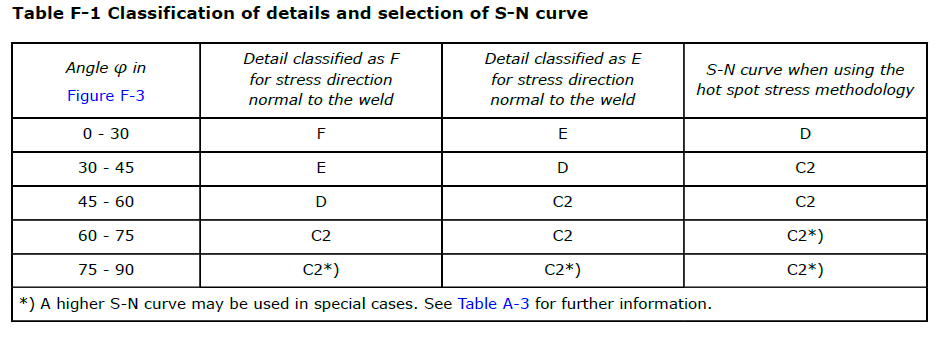
Figure 2: Table F-1 from DNV RP-C203, illustrating the classification of details and selection of S-N curve based on principal stress angle and joint classification.

Figure 3: SDC Verifier interface for classifying details and selecting S-N curves based on principal stress angle and joint classification.
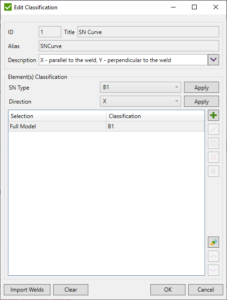
Figure 4: “Edit Classification” window for defining S-N curve parameters and direction.
The software also accounts for the directional classification of S-N curves (X and Y directions), as shown in Figure 4. In this example, the user has selected an SN Type of B1 and a Direction of X, which corresponds to a weld parallel to the direction of the applied stress. The software then applies the appropriate S-N curve for each scenario, as per DNV RP-C203 guidelines.
The Weld Finder tool in SDC Verifier automatically recognizes welds and converts stresses from local element directions to weld directions, making it easy to apply the correct S-N curve for each scenario.
For example, a butt weld with stresses perpendicular to the weld would typically be classified as category D, while a fillet weld transmitting shear flow would be classified as category E. The software’s intuitive interface allows users to easily verify these classifications and make adjustments if necessary.
4. Fatigue Life Calculation
Calculates fatigue life using Miner’s rule (Equation 2.2.1 in DNV RP-C203 (2016)) or other relevant cumulative damage methods, considering the stress history of each hotspot and providing a comprehensive assessment of the structure’s fatigue performance.
The stress history for each load case is determined from the FEA results, and the appropriate S-N curve is applied to calculate the damage caused by each stress cycle.
Read More: Why Efficient Hydrodynamic Load Modeling is Essential for Sustainable Offshore Platforms
The cumulative damage is then calculated by summing the damage contributions from all load cases.
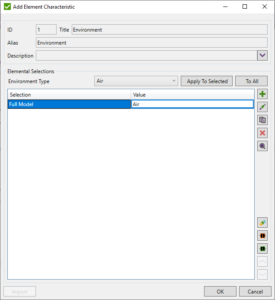
Figure 5: selection of the environmental type for the fatigue analysis according to DNV RP-C203.
Tip: The setup process allows for defining the environmental conditions for their fatigue analysis. As shown in Figure 5, users can select between “Air” and “Seawater with Cathodic Protection” directly within the software interface, ensuring that the appropriate S-N curves and correction factors are applied according to DNV RP-C203. This simplifies the process of accounting for the impact of environmental corrosion on fatigue life.
5. Thickness Correction
Automatically applies thickness correction factors to S-N curves as per DNV RP-C203 recommendations (Equation 2.4.3), ensuring accurate fatigue life predictions for components of varying thicknesses.
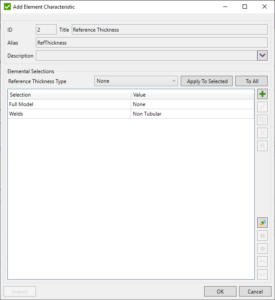
Figure 6: “Add Element Characteristic” window for defining reference thicknesses for fatigue analysis.
The software allows users to easily define the reference thickness for different types of elements (welds, tubular joints, etc.) in the “Add Element Characteristic” window, as shown in Figure 6. This simplifies the process of accounting for the effect of thickness on fatigue strength.
6. Mean Stress Correction
Accounts for the influence of mean stress on fatigue strength by applying appropriate correction factors (e.g., Goodman, Gerber) to the S-N curves, as recommended by DNV RP-C203 (Section 2.5).
Note: The accuracy and reliability of SDC Verifier have been rigorously validated through extensive comparison against hand calculations performed by experienced fatigue engineers and established industry benchmarks.
Applications in Offshore Structure Design
The software offers a comprehensive suite of tools tailored to the unique fatigue challenges faced by different types of designs:
| Offshore Structure Type | SDC Verifier Capabilities and Benefits |
|---|---|
| Fixed Offshore Platforms | Handles complex geometries, multi-member joints, and diverse load combinations. Automated hotspot identification, stress linearization, and thickness correction. Assesses fatigue life of cast and forged nodes. |
| Jacket Structures | Specialized tools for analyzing tubular joints. Integration with FEA results and automated S-N curve application. Streamlines compliance and enables design optimization. |
| Floating Structures (FPSOs, Semi-Submersibles) | Dynamic analysis capabilities for vessel motions, wave-induced loads, and multi-body interactions. Accurate fatigue life prediction in challenging environments. |
| Topside Modules and Equipment | Analyzes fatigue performance of process equipment, cranes, helidecks, etc. Identifies potential failure points and guides design modifications. |
| Subsea Structures (Manifolds, Pipelines) | Assesses fatigue life of manifolds, pipelines, and other components under cyclic pressure and temperature fluctuations. Incorporates stress concentration factors for specific details. |
Conclusion
By automating the intricate calculations, streamlining the workflow, and providing intuitive visualization and reporting tools, the software empowers engineers to:
- Drastically reduce the time spent on manual calculations and data processing.
- Minimize the risk of human error through automated workflows and robust algorithms of fatigue life predictions.
- Proactively identify and address potential fatigue hotspots, and longevity of offshore structures.
- Integrate fatigue analysis into the design optimization process to achieve the most efficient and reliable structural configurations.
Don’t let the complexities of DNV RP-C203 compliance hinder your engineering innovation.
