Introduction
Rainflow Counting method is used to determine the number of fatigue cycles that is based on a load-time history. It is used in the analysis of fatigue data in order to reduce a spectrum of varying stresses into a set of simple stress reversals. This simplification allows the number of cycles until failure of a component to be determined for each rainflow cycle using either Miner’s rule to calculate the fatigue damage, or in a crack growth equation to calculate the crack increments.
History Reference
The Rainflow-Counting algorithm was developed by Tatsuo Endo and M. Matsuishi in 1968. It became the first accepted method to extract closed loading reversals or cycles. In 1982, Downing and Socie created one of the more widely referenced and utilized rainflow cycle-counting algorithms. Later, Igor Rychlik gave a mathematical definition for the rainflow counting method, enabling closed-form computations from the statistical properties of the load signal.
Rainflow Counting Algorithm
The “rainflow” definition of the method comes from a comparison to the flow of rain falling on a pagoda and running down the roof’s edges. The pagoda roof method consists of the following steps:
- Reduce the time history to a sequence of (tensile) peaks and (compressive) valleys.
- Imagine that the time history is a template remaindering a pagoda roof.
- Turn the template clockwise 90° (the earliest time to the top) till it looks like a pagoda roof.
- Each tensile peak is imagined as a source of water that “drips” down the pagoda.
- Count the number of half-cycles by looking for terminations in the flow occurring when either: the end of the time history is reached; merged with a flow that started at an earlier tensile peak; or flows when an opposite tensile peak has greater or equal magnitude.
- Repeat step 5 for compressive valleys.
- Assign a stress range Δσ = σmax – σmin to each half-cycle equal to the stress difference between its start and termination.
Pair up half-cycles of identical magnitude but opposite sense to count the number of complete cycles. Unmatched half-cycles are residual half-cycles.
Rainflow Counting algorithm consists of four main steps described in standards such as ASTM E1049 “Standard Practices for Cycle Counting in Fatigue Analysis”:
- Peak-Valley Filtering
- Hysteresis Filtering
- Discretization (Binning)
- Half Cycle Method and Four Point Method
Peak-Valley filtering
Peak-Valley filtering removes all the intermediate load-time history results that are between all Peak and Valley pairs in order to get only minimum and maximum values of a cycle that are important for fatigue calculations:
Initial (gray line) is the original load-time history of all the loads included in Load Group. Peak-Valley Filtering (dark gray line) is a filtered load-time history with excluded intermediate data points. Peak-Valley load-time history is used in further calculations.

Hysteresis filtering
Hysteresis filtering removes small stress ranges obtained after Peak-Valley filtering that have a negligible influence on damage:
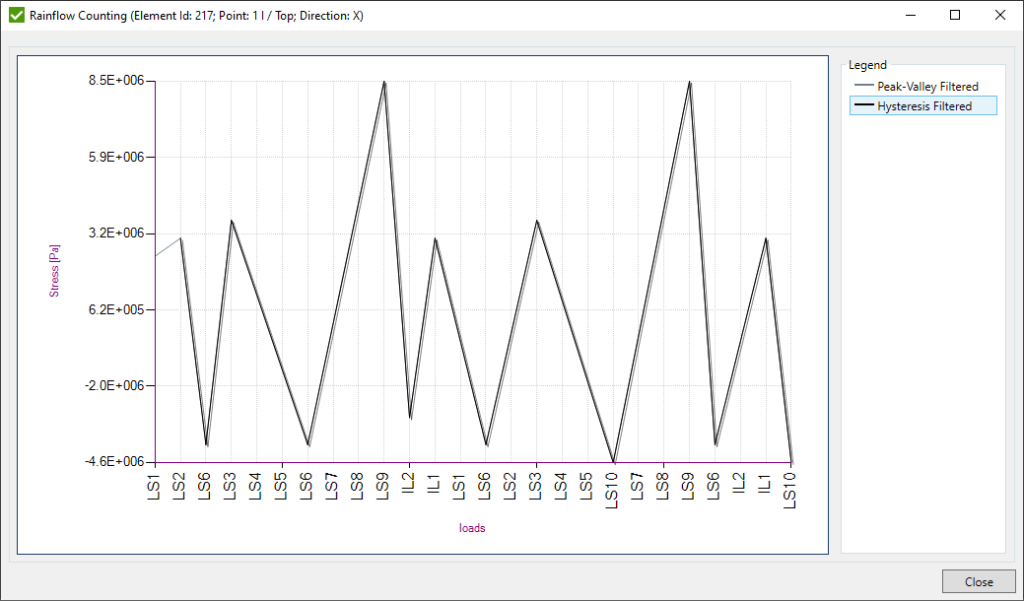
Peak-Valley (dark gray line) data is obtained from Step 1. Hysteresis Filtering (black line) is a filtered load-time history that excludes stress ranges that are smaller than the gate (percentage or actual value defined in the settings). Hysteresis load-time history is used in further calculations.
Ready to experience the power of SDC Verifier’s Rainflow Counting Tool? Start simplifying your fatigue analysis workflow today!
Discretization (Binning)
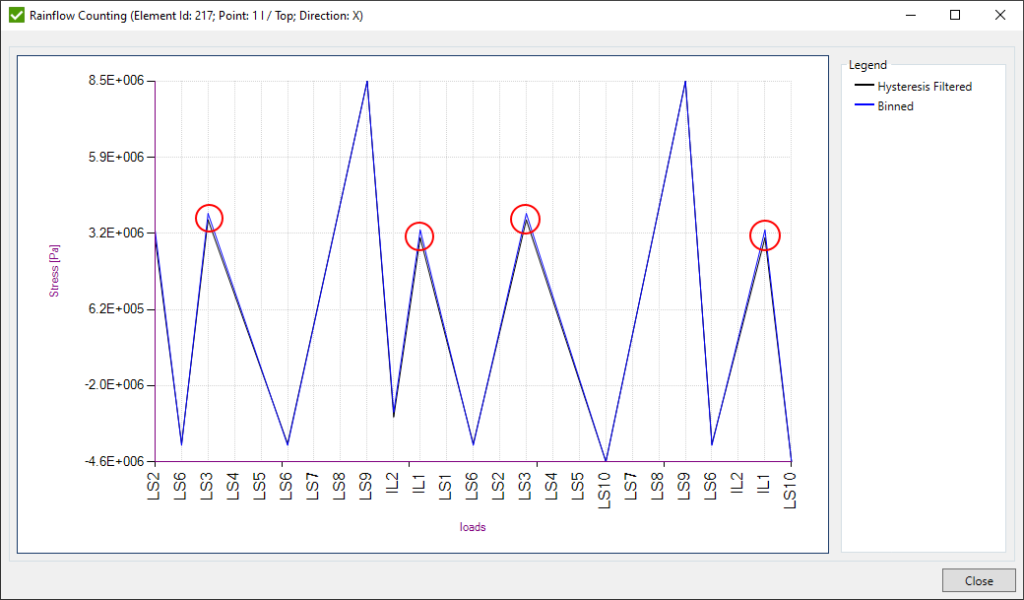
Hysteresis Filtering (black line) data is obtained from the Step 2. Binned (blue line) is a modified data after placing data to the centers of respective bins. Binned load-time history is used in further calculations.
Half Cycle Method
Half Cycle Method also known as Pagoda roof method counts half the cycle for each stress between its start and termination. Counting can be done for both Valley-to-Peak (Left-to-Right) and Peak-to-Valley (Right-to-Left) or for any of them that depends on the selected Half Cycle Calculation option.
Green (Peak-to-Valley) and red (Valley-to-Peak) lines on the picture below represents the counting path:

All the obtained stress ranges are gathered into the table and each occurred range is set 0.5 cycle. Afterwards all similar cycles are summarized that results in the Half Cycle Data table:

Four Point Method
This method evaluates each set of 4 data points A-B-C-D of the binned data in turn to determine residual stresses and a rainflow matrix with number of cycles. The identified cycle is stored into a rainflow matrix which is an n x n matrix (n = number of bins). Each matrix’s element contains the number of cycles found in the time history corresponding to the ‘From’ and ‘To’ amplitudes. To save the memory, SDC Verifier keeps only the list of ‘From’ – ‘To’ values that have at least 1 cycle which are represented in a Matrix graph. The algorithm compares the stress ranges of points A-D and B-C and sets 1 cycle for the range of results using a stress value at point B (from) and point C (to) only if A-D >= B-C.

Numbered data points and each set of 4 points is checked. Points that are currently checked are highlighted in cream color. Points that are eliminated are crossed out, and they provide a counted cycle. Rest of the points that do not provide a cycle represent a Residual Stress. A cycle is counted if inner stress range (B-C) ≤ to outer stress range (A-D) and the points comprising the inner stress range are bounded by the outer

Residual stress and rainflow matrix of calculated cycles are displayed on the graphs:

Implementation of Rainflow Counting Tool in SDC Verifier
SDC Verifier has implemented the Rainflow Counting tool since the 2021 R2 version. With the Rainflow Counting tool, users can calculate cycles from stress ranges with two methods: half-cycle data and four points data. The tool is available in the Tools menu in SDC Verifier. The feature is crucial for engineers who do fatigue calculations.
To open Rainflow Counting Tool, execute Tool – Rainflow Counting from the main menu.
Interface / Functions description
Rainflow Counting Tool main window contain these blocks for setup: Option, Settings, Selection and Results Tables and Graphs. In the selection block, you can select part of the model to be calculated by the tool. In options and settings block, you can modify parameters for calculations (Learn more in help article). Results in Rainflow Counting tool are presented in a table right upper corner and a residue graph, and Matrix.

Usage in Fatigue Standards
The Rainflow Counting method, in conjunction with fatigue analysis, plays a crucial role in adhering to industry standards such as:
- Eurocode3 Fatigue (EN1993-1-9, 2005)
- EN 13001 Fatigue (2018)
- DIN 15018 (1984)
- F.E.M. 1.001 (3rd, 1998)
These standards are widely adopted in the Heavy Lifting and Offshore industries for ensuring the fatigue resistance of structures subjected to cyclic loading.
Usage Rainflow Counting results in checks
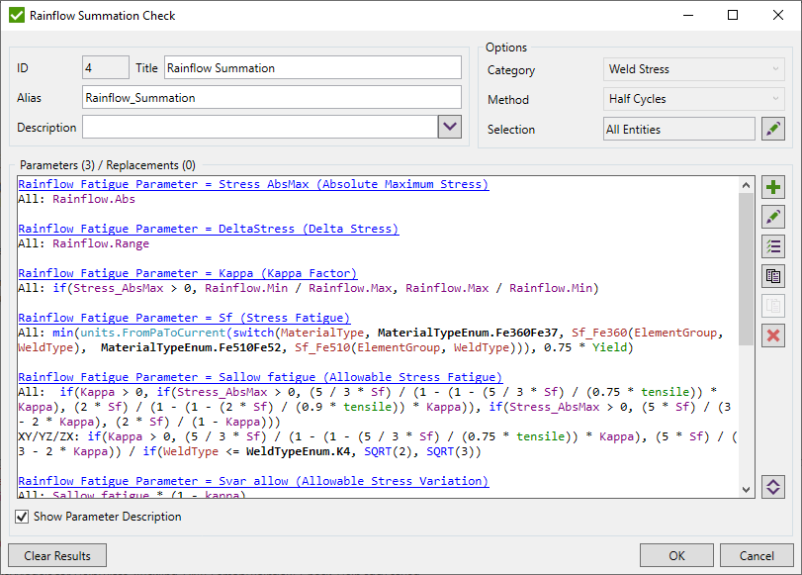
Results of Rainflow Counting tool stored in special functions variables which can be used in custom checks. Among these variables are:
- Rainflow.From – Start value of the calculated range
- Rainflow.To – End value of the calculated range
- Rainflow.Range – Calculated range value
- Rainflow.Cycles – Number of the repeated cycles of the calculated range
- Rainflow.Min – Minimum value of From and To
- Rainflow.Max – Maximum value of From and To
- Rainflow.Abs – Absolute Maximum value of From and To
Custom Rainflow Summation Check calculates user-defined formulas at each point of interest of the element, based on Rainflow Counting Tool data.
Gain confidence in your designs with SDC Verifier’s advanced fatigue analysis capabilities. Try the Rainflow Counting tool and other essential features during your free trial.


