Structural Verification in Ship Design: A Practical Guide for Engineers
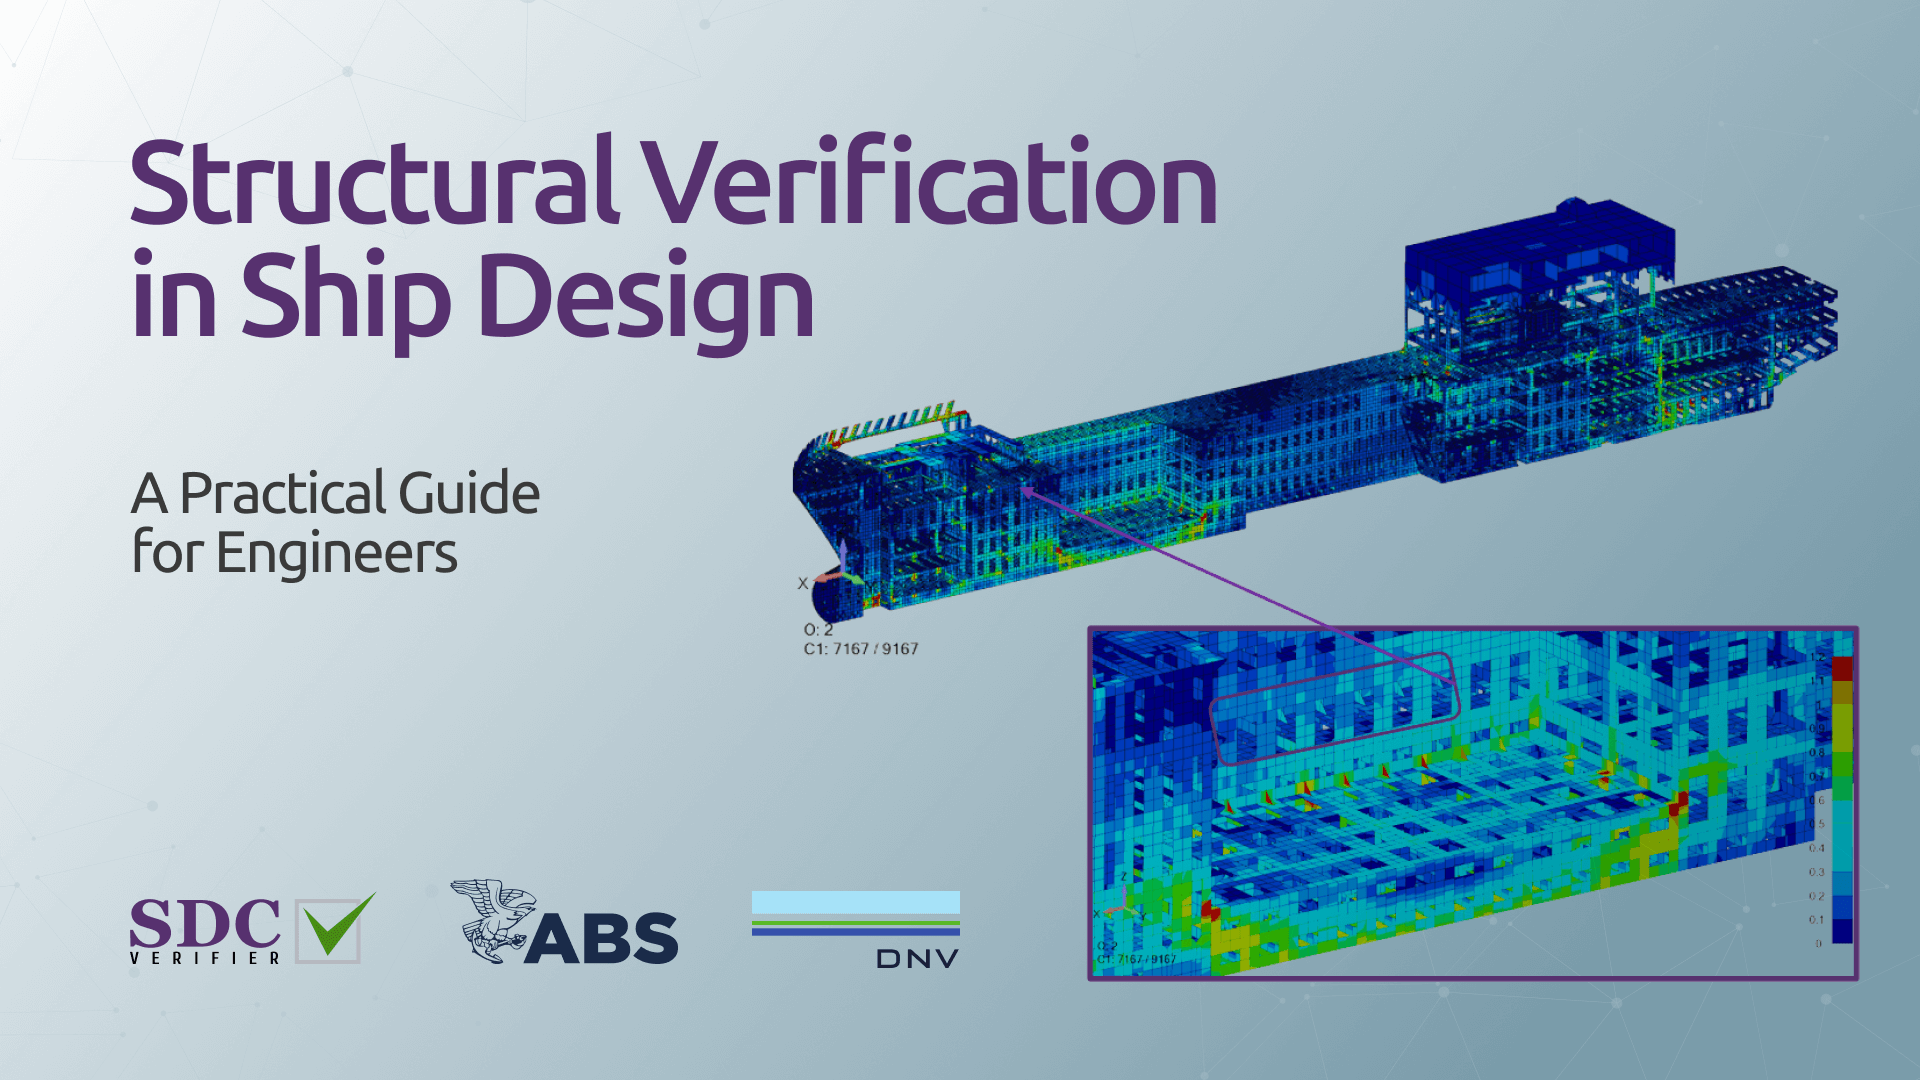
Every maritime engineer knows the stakes: vessels must withstand relentless forces — compressive loads that threaten buckling and cyclic stresses that induce fatigue cracks. These challenges are not theoretical — they directly impact ship design safety, durability, and compliance. With ABS and DNV standards setting the bar, the question remains: how do engineers efficiently achieve this precision without compromising accuracy?
Engineering Challenges in Modern Ship Design
The structural demands placed on maritime vessels are relentless. Ships are subjected to extreme conditions that test their ability to withstand deformation, stress, and fatigue. Two of the most critical challenges engineers face in ship design are plate buckling and fatigue cracking.
Plate Buckling
Causes: Plate buckling occurs when compressive stresses, often due to loading conditions or external forces, exceed a structure’s critical stress threshold. This can result in sudden, localized deformation of structural plates, especially in thin-walled components commonly used in maritime structures.
Implications: Buckling compromises the load-carrying capacity of a vessel’s structure. Left unchecked, it can propagate into larger-scale structural failures, jeopardizing the ship’s operational safety and compliance with classification society standards like American Bureau of Shipping, Det Norske Veritas, Lloyd’s Register, or Bureau Veritas. This is particularly critical in high-stress areas such as decks, bulkheads, and stiffened panels.
Fatigue Cracking
Causes: Fatigue cracking is a result of progressive damage caused by repeated loading and unloading cycles over time. It is a cumulative process that accelerates in regions with high stress concentrations, such as weld intersections and sharp geometric transitions. Environmental factors, like sea conditions and corrosion, exacerbate this process.
Implications: Fatigue weakens a structure’s durability and necessitates increased maintenance, inspections, and potential downtime. Cracks originating in critical zones can propagate rapidly, reducing the lifespan of a vessel and increasing the likelihood of catastrophic failure if undetected.
These challenges underline the necessity for precise structural verification. Relying solely on manual methods increases the risk of oversights, inconsistent results, and delays. Engineers require tools and workflows that ensure compliance with standards like ABS and DNV, while enabling efficient identification and mitigation of these structural vulnerabilities.
How FEA Transform Ship Design
Finite Element Analysis (FEA) has become an indispensable tool for engineers tackling the complexities of modern ship design. By simulating how structures respond to real-world forces, FEA provides the precision and clarity needed to navigate stringent regulatory requirements while ensuring structural reliability.
FEA enables engineers to deconstruct complex maritime structures into manageable elements, allowing for the precise calculation of stress, strain, and deformation. This granular approach is critical for identifying vulnerabilities like plate buckling or fatigue cracks before they manifest in physical structures.
- Localized Insights: FEA highlights areas prone to stress concentration, such as weld intersections or unreinforced panels, ensuring that potential failures are addressed during the design phase.
- Scenario Simulation: It provides the flexibility to simulate different loading conditions, environmental factors, and material properties, offering a comprehensive understanding of structural behavior.
How Standards Like ABS and DNV Provide Frameworks for Verification
Regulatory standards such as ABS and DNV codify best practices for structural design and verification, ensuring safety and reliability. These standards prescribe:
- Methodologies for Analysis: Guidelines for assessing buckling resistance, fatigue life, and overall structural integrity.
- Design Criteria: Minimum requirements for material properties, load combinations, and safety factors.
- Validation Procedures: Steps to ensure compliance through systematic checks and documentation.
While FEA provides the technical foundation, ABS and DNV serve as the regulatory compass, ensuring that analysis results align with industry expectations.
To provide engineers with a clear understanding of the differences between ABS and DNV standards, here’s a concise comparison table highlighting key aspects:
| Aspect | ABS (American Bureau of Shipping) |
DNV (Det Norske Veritas) |
|
Scope and Coverage |
Focuses on U.S. and international shipping markets. |
Global reach with emphasis on European and offshore industries. |
|
Structural Verification |
Includes global and local strength checks with defined criteria for fatigue, buckling, and stability. |
Offers detailed guidance on buckling, fatigue, and environmental impacts, with advanced simulations. |
|
Load Combinations |
Prescribes specific load cases for operational and extreme scenarios. |
Provides a wider variety of load combinations, including probabilistic methods. |
|
Material Properties |
Lists minimum yield strengths and material behavior under various stresses. |
Emphasizes corrosion allowance and thickness variations due to environmental factors. |
|
Fatigue Analysis |
Fatigue checks based on deterministic methods, using S-N curves. |
Comprehensive fatigue analysis incorporating stochastic and deterministic methods. |
|
Buckling Resistance |
Defines allowable stress and thickness-based criteria for buckling checks. |
Offers options for both average-stress and element-based buckling methods. |
|
Environmental Considerations |
Basic wave loading and wind effects for global strength evaluations. |
Incorporates advanced environmental factors like wave spectra and wind profiles. |
|
Documentation Requirements |
Extensive but allows flexibility in report formatting. |
Rigid documentation with detailed step-by-step verification requirements. |
|
Preferred Use Cases |
Suited for bulk carriers, tankers, and general-purpose vessels. |
Ideal for offshore platforms, wind farm support vessels, and advanced ship designs. |
|
Regional Relevance |
Strong adoption in the Americas and Asia-Pacific. |
Widely adopted across Europe, with significant use in offshore industries. |
Table: Comparison of ABS and DNV standards for structural verification in maritime engineering, highlighting differences in scope, methodology, and applications.
Challenges Engineers Face in Manual Compliance Checks
Despite the advantages of FEA, achieving compliance through manual processes introduces significant inefficiencies:
- Repetitive Workflows: Engineers often spend excessive time preparing models, applying standards, and recalculating results for design iterations.
- High Risk of Errors: Manual input increases the likelihood of inconsistencies in applying standards, particularly in large or complex models.
- Time-Consuming Reporting: Compiling detailed, compliant reports manually is labor-intensive, diverting focus from problem-solving to administrative tasks.
These challenges underscore the need for integrated solutions that combine the analytical rigor of FEA with automated workflows tailored to meet ABS and DNV requirements.
Step-by-Step Workflow for Structural Verification
Effective structural verification requires a methodical and precise approach, balancing complexity with efficiency. Below is a streamlined workflow in SDC Verifier software that incorporates advanced engineering practices to ensure accuracy and compliance in ship design verification.
Model Preparation
The foundation of any structural verification lies in an accurate and well-defined model. This stage ensures that all geometrical and material complexities are accounted for:
- Geometry Import and Creation: Engineers can either import existing CAD models from design software or build geometry from scratch within the verification tool. Support for multiple file formats (e.g., STEP, IGES) ensures compatibility with various design environments.
Note: For maritime vessels, curved surfaces and non-standard sections are critical to capture accurately, as they often contribute to unique stress behaviors.
- Handling Complex Shapes: Ship structures often include curved panels, irregular stiffeners, and custom sections. These are accounted for during model preparation, enabling accurate simulation of real-world conditions.
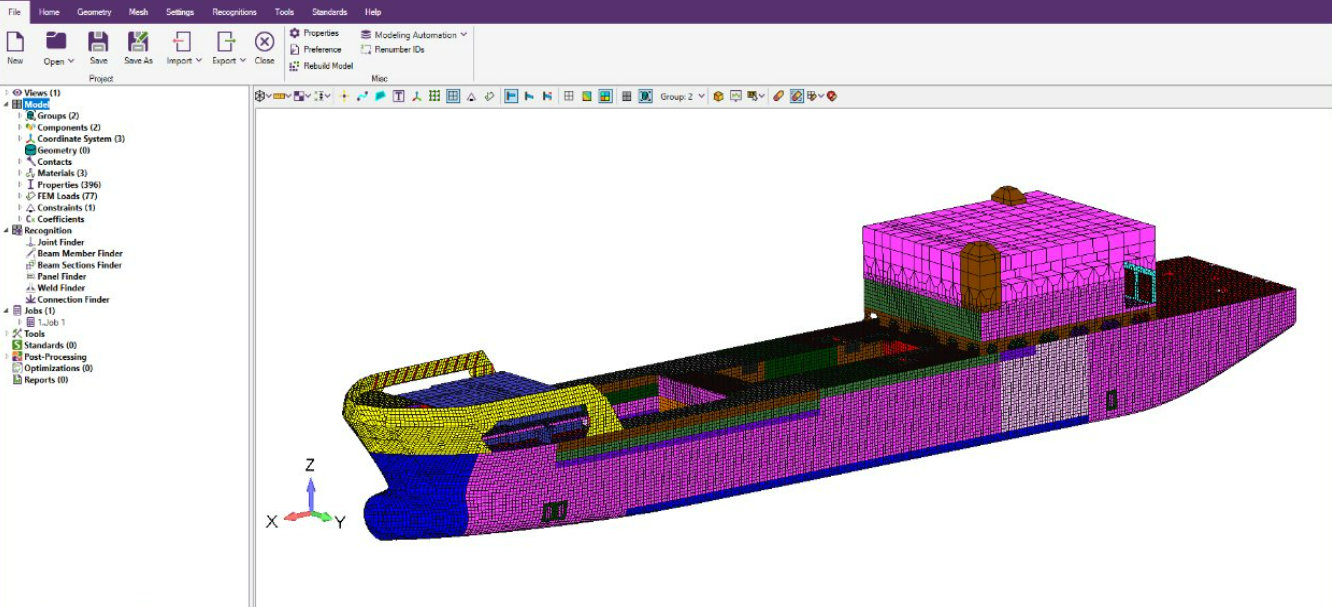
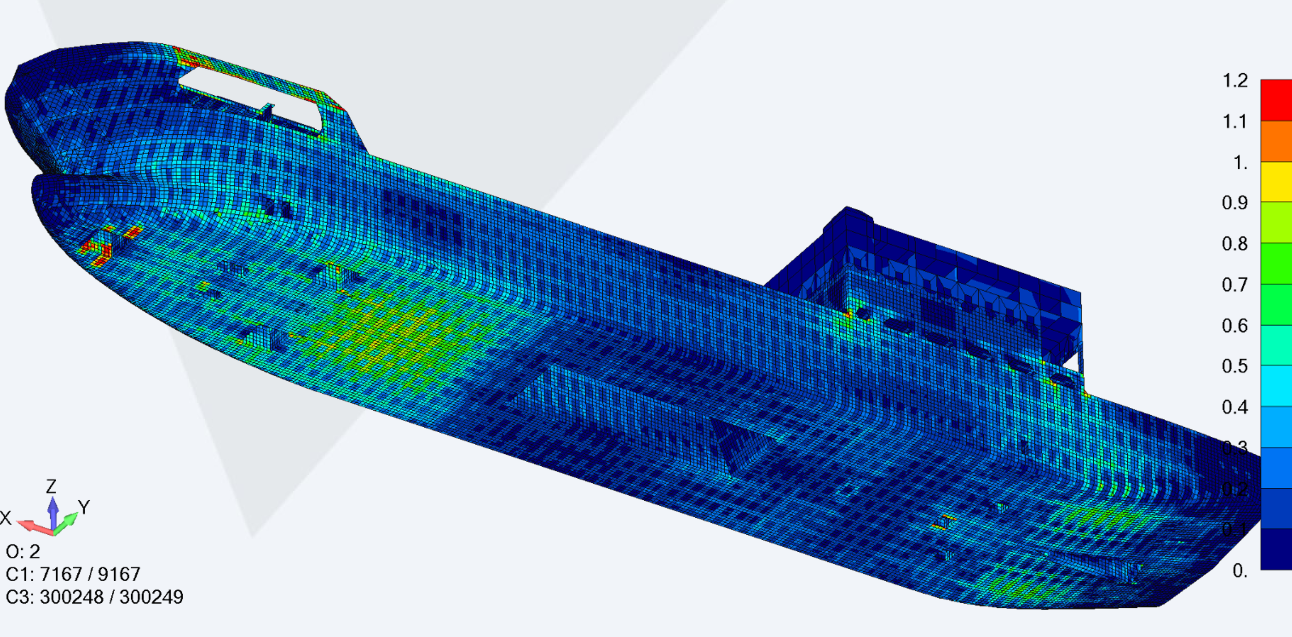
Image: FEA model of a ship, illustrating how complex structures are prepared for verification, including detailed panels, stiffeners, and curved surfaces.
- Meshing for Analysis: High-quality meshing, using beam, plate, or solid elements, is crucial for accurate stress and strain calculations. Adaptive meshing tools enable refinement in areas of high stress or complex geometry.
Load Application
Applying loads accurately is critical to realistic verification. Ship structures endure a wide range of operational forces, which must be represented faithfully in the analysis:
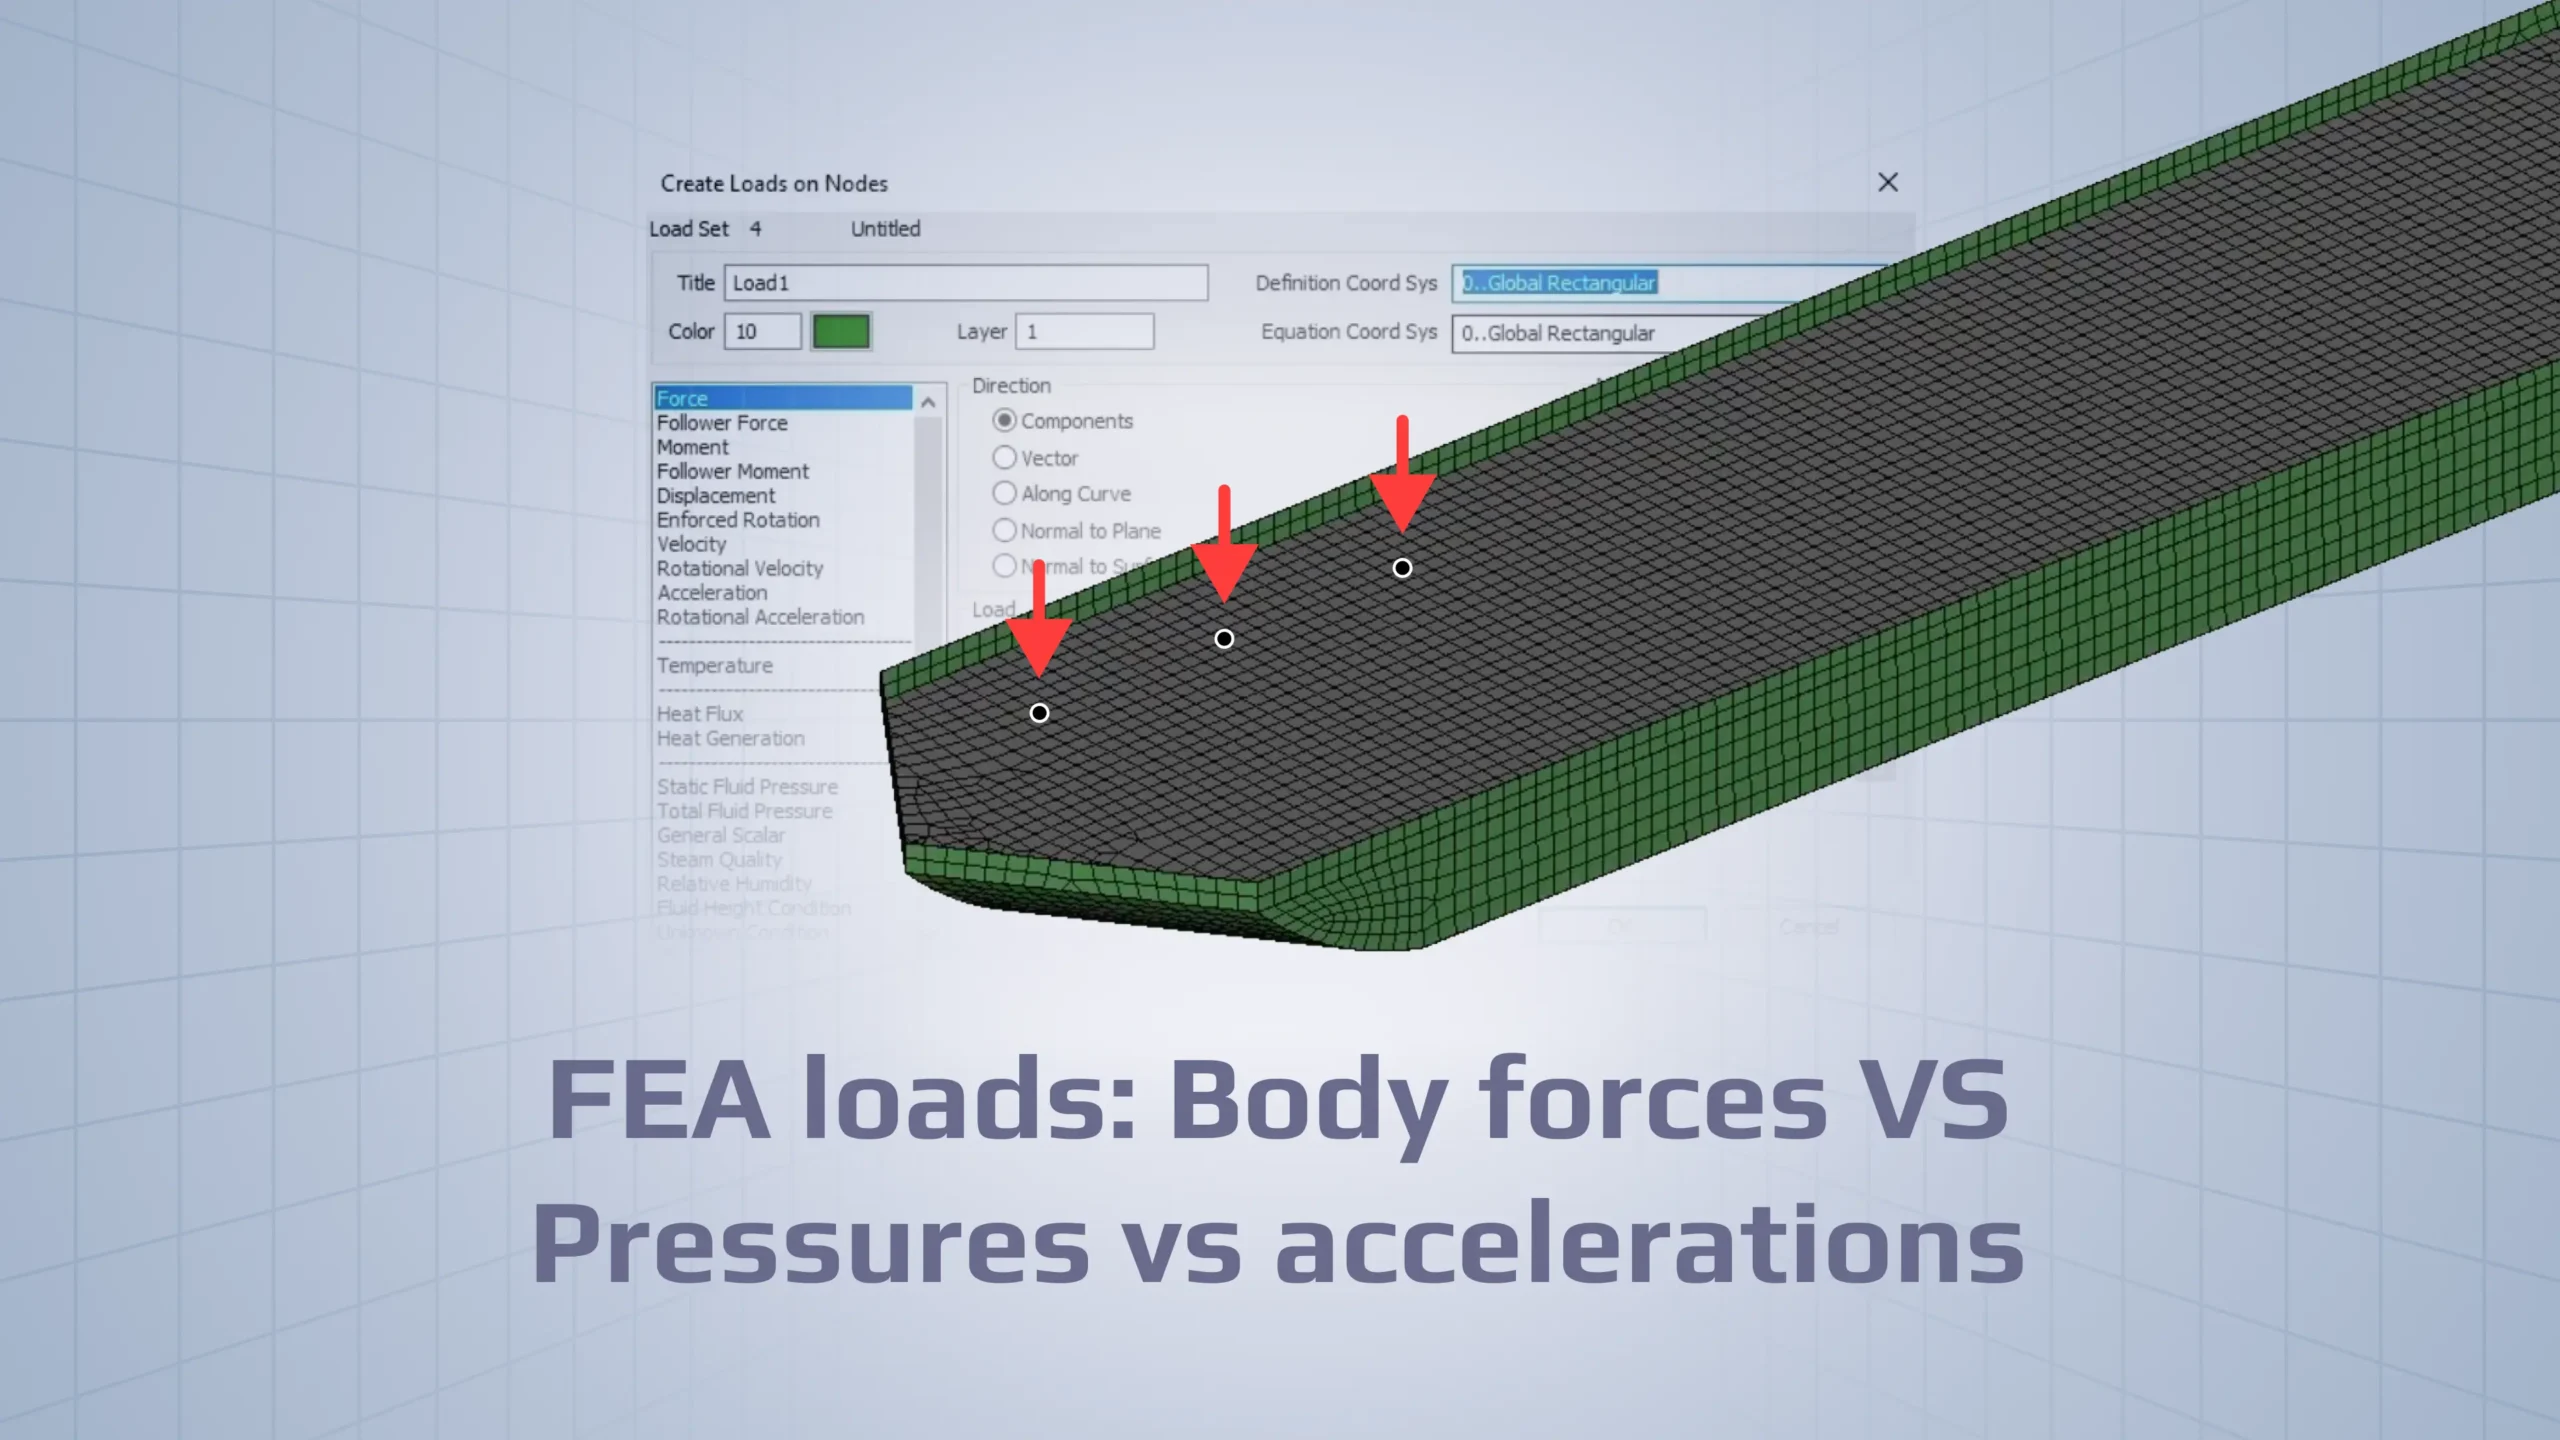
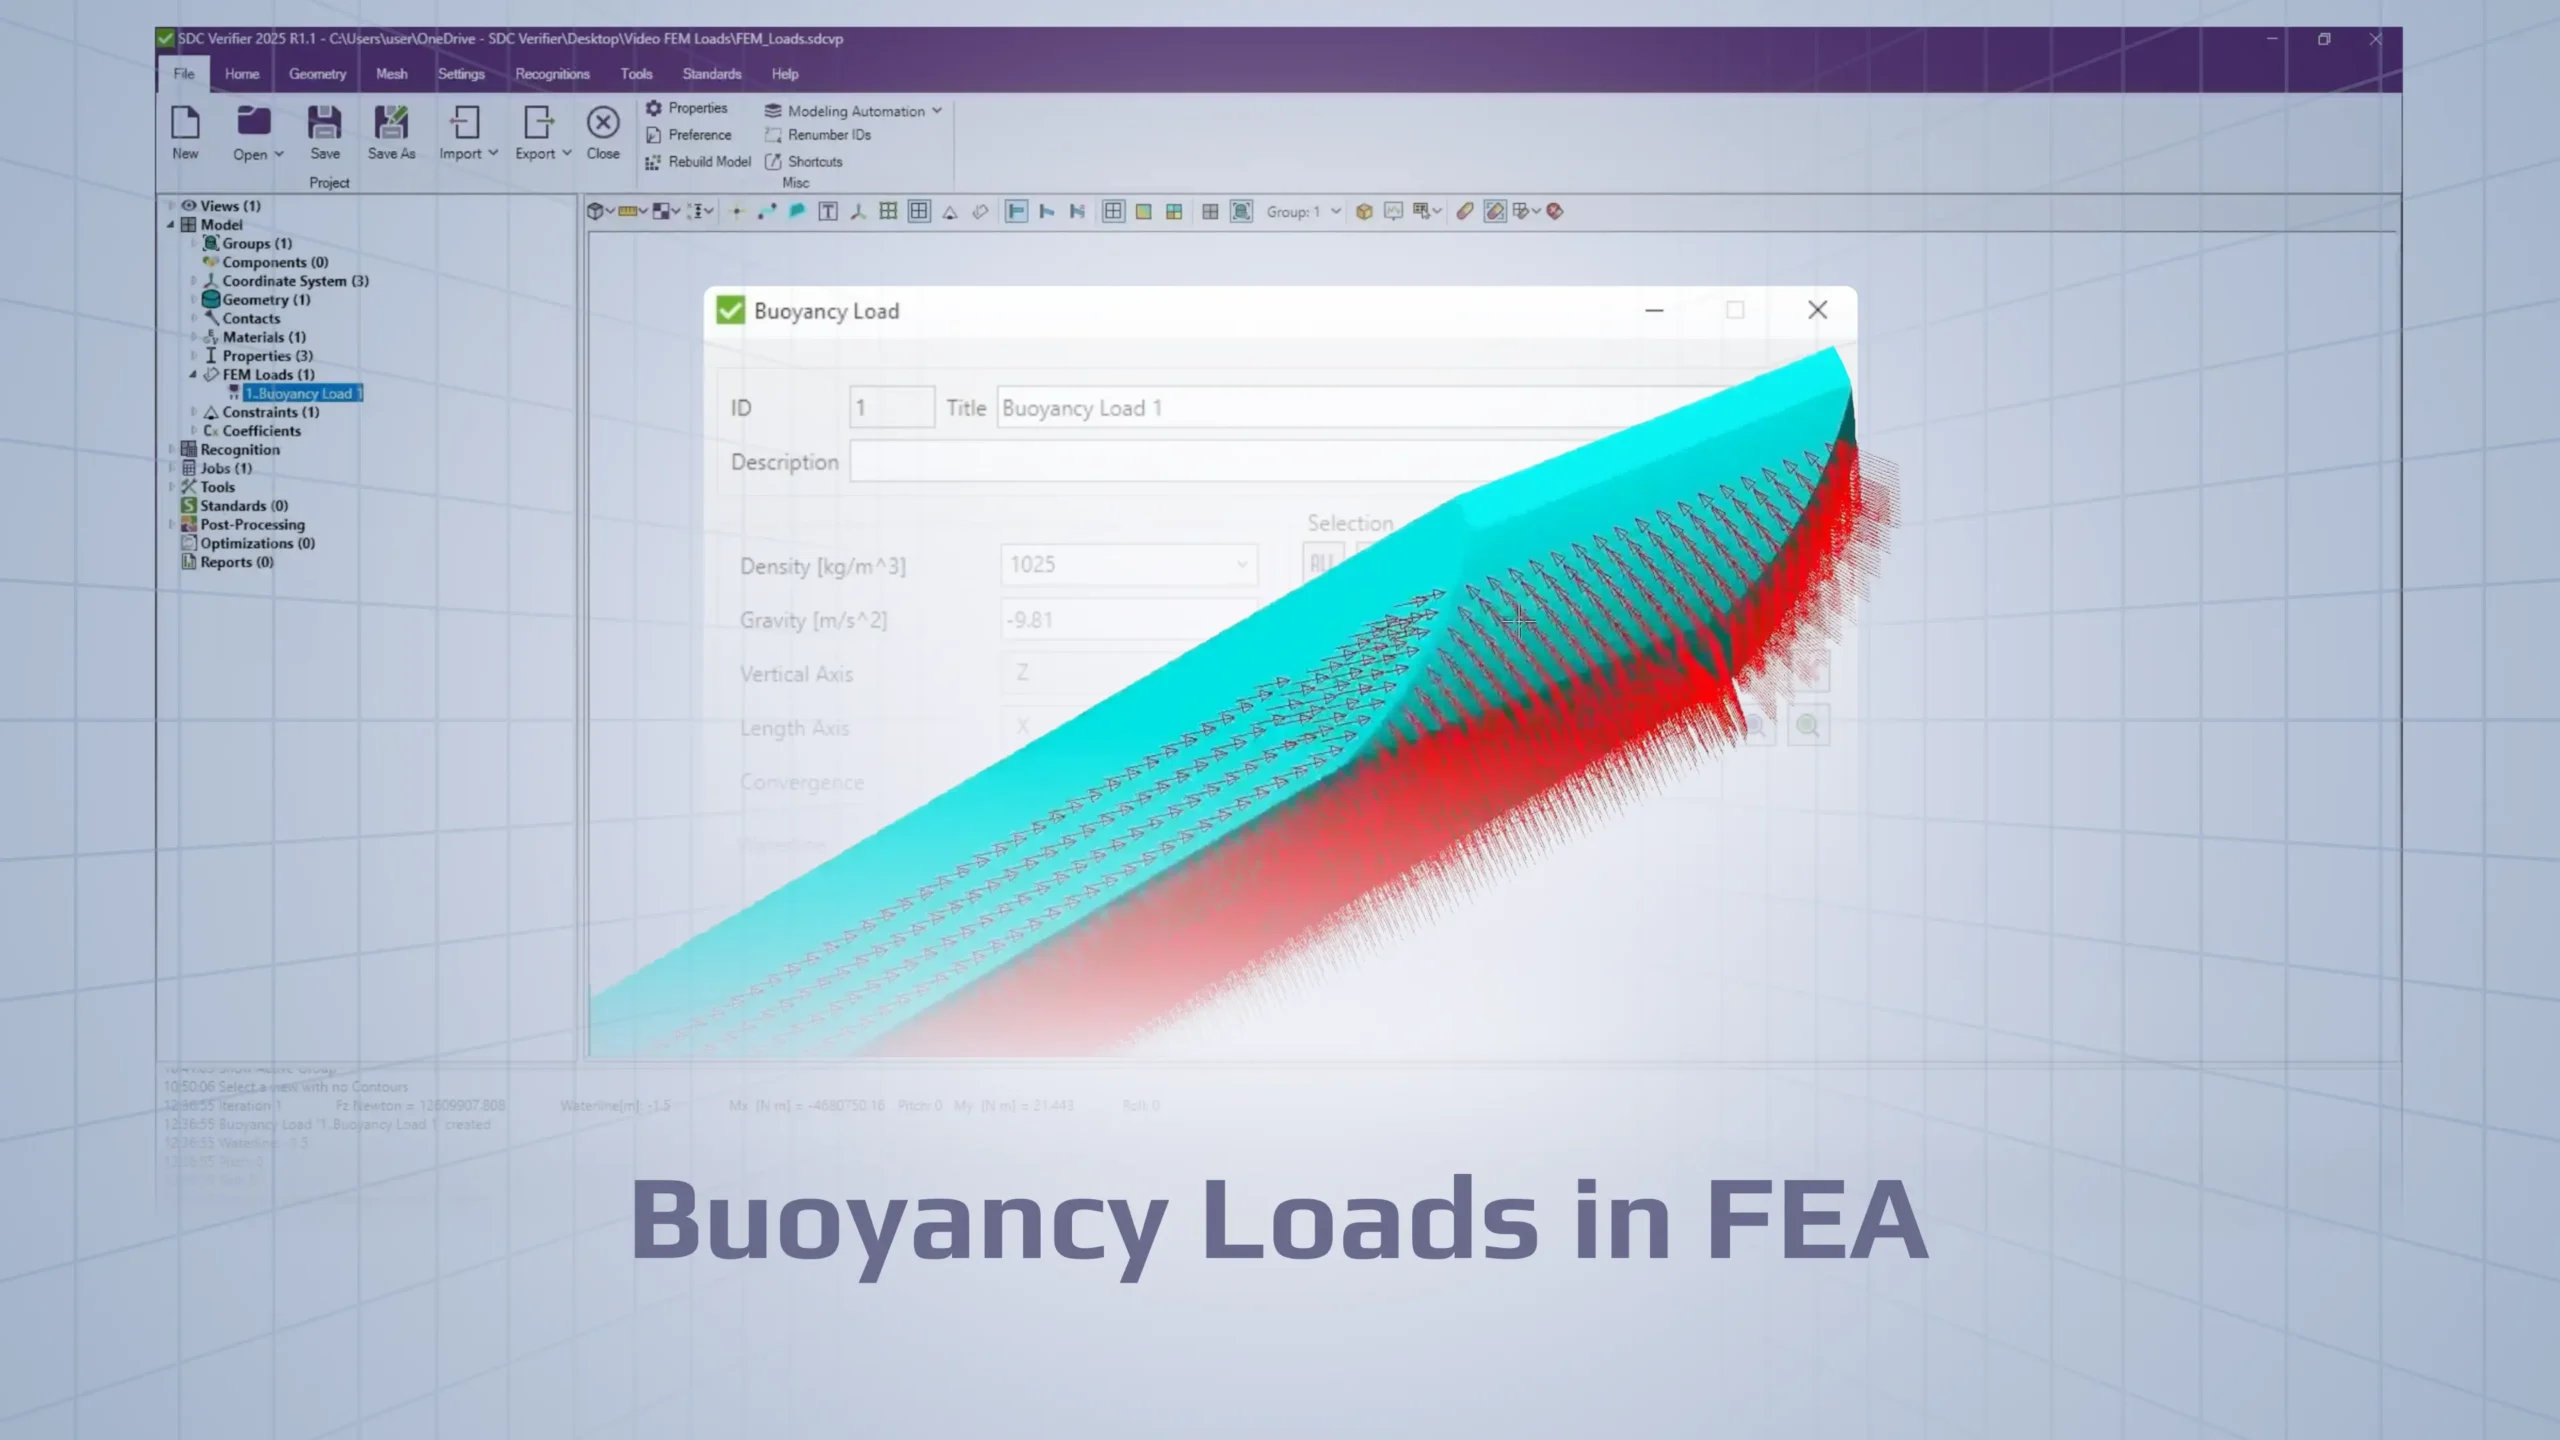
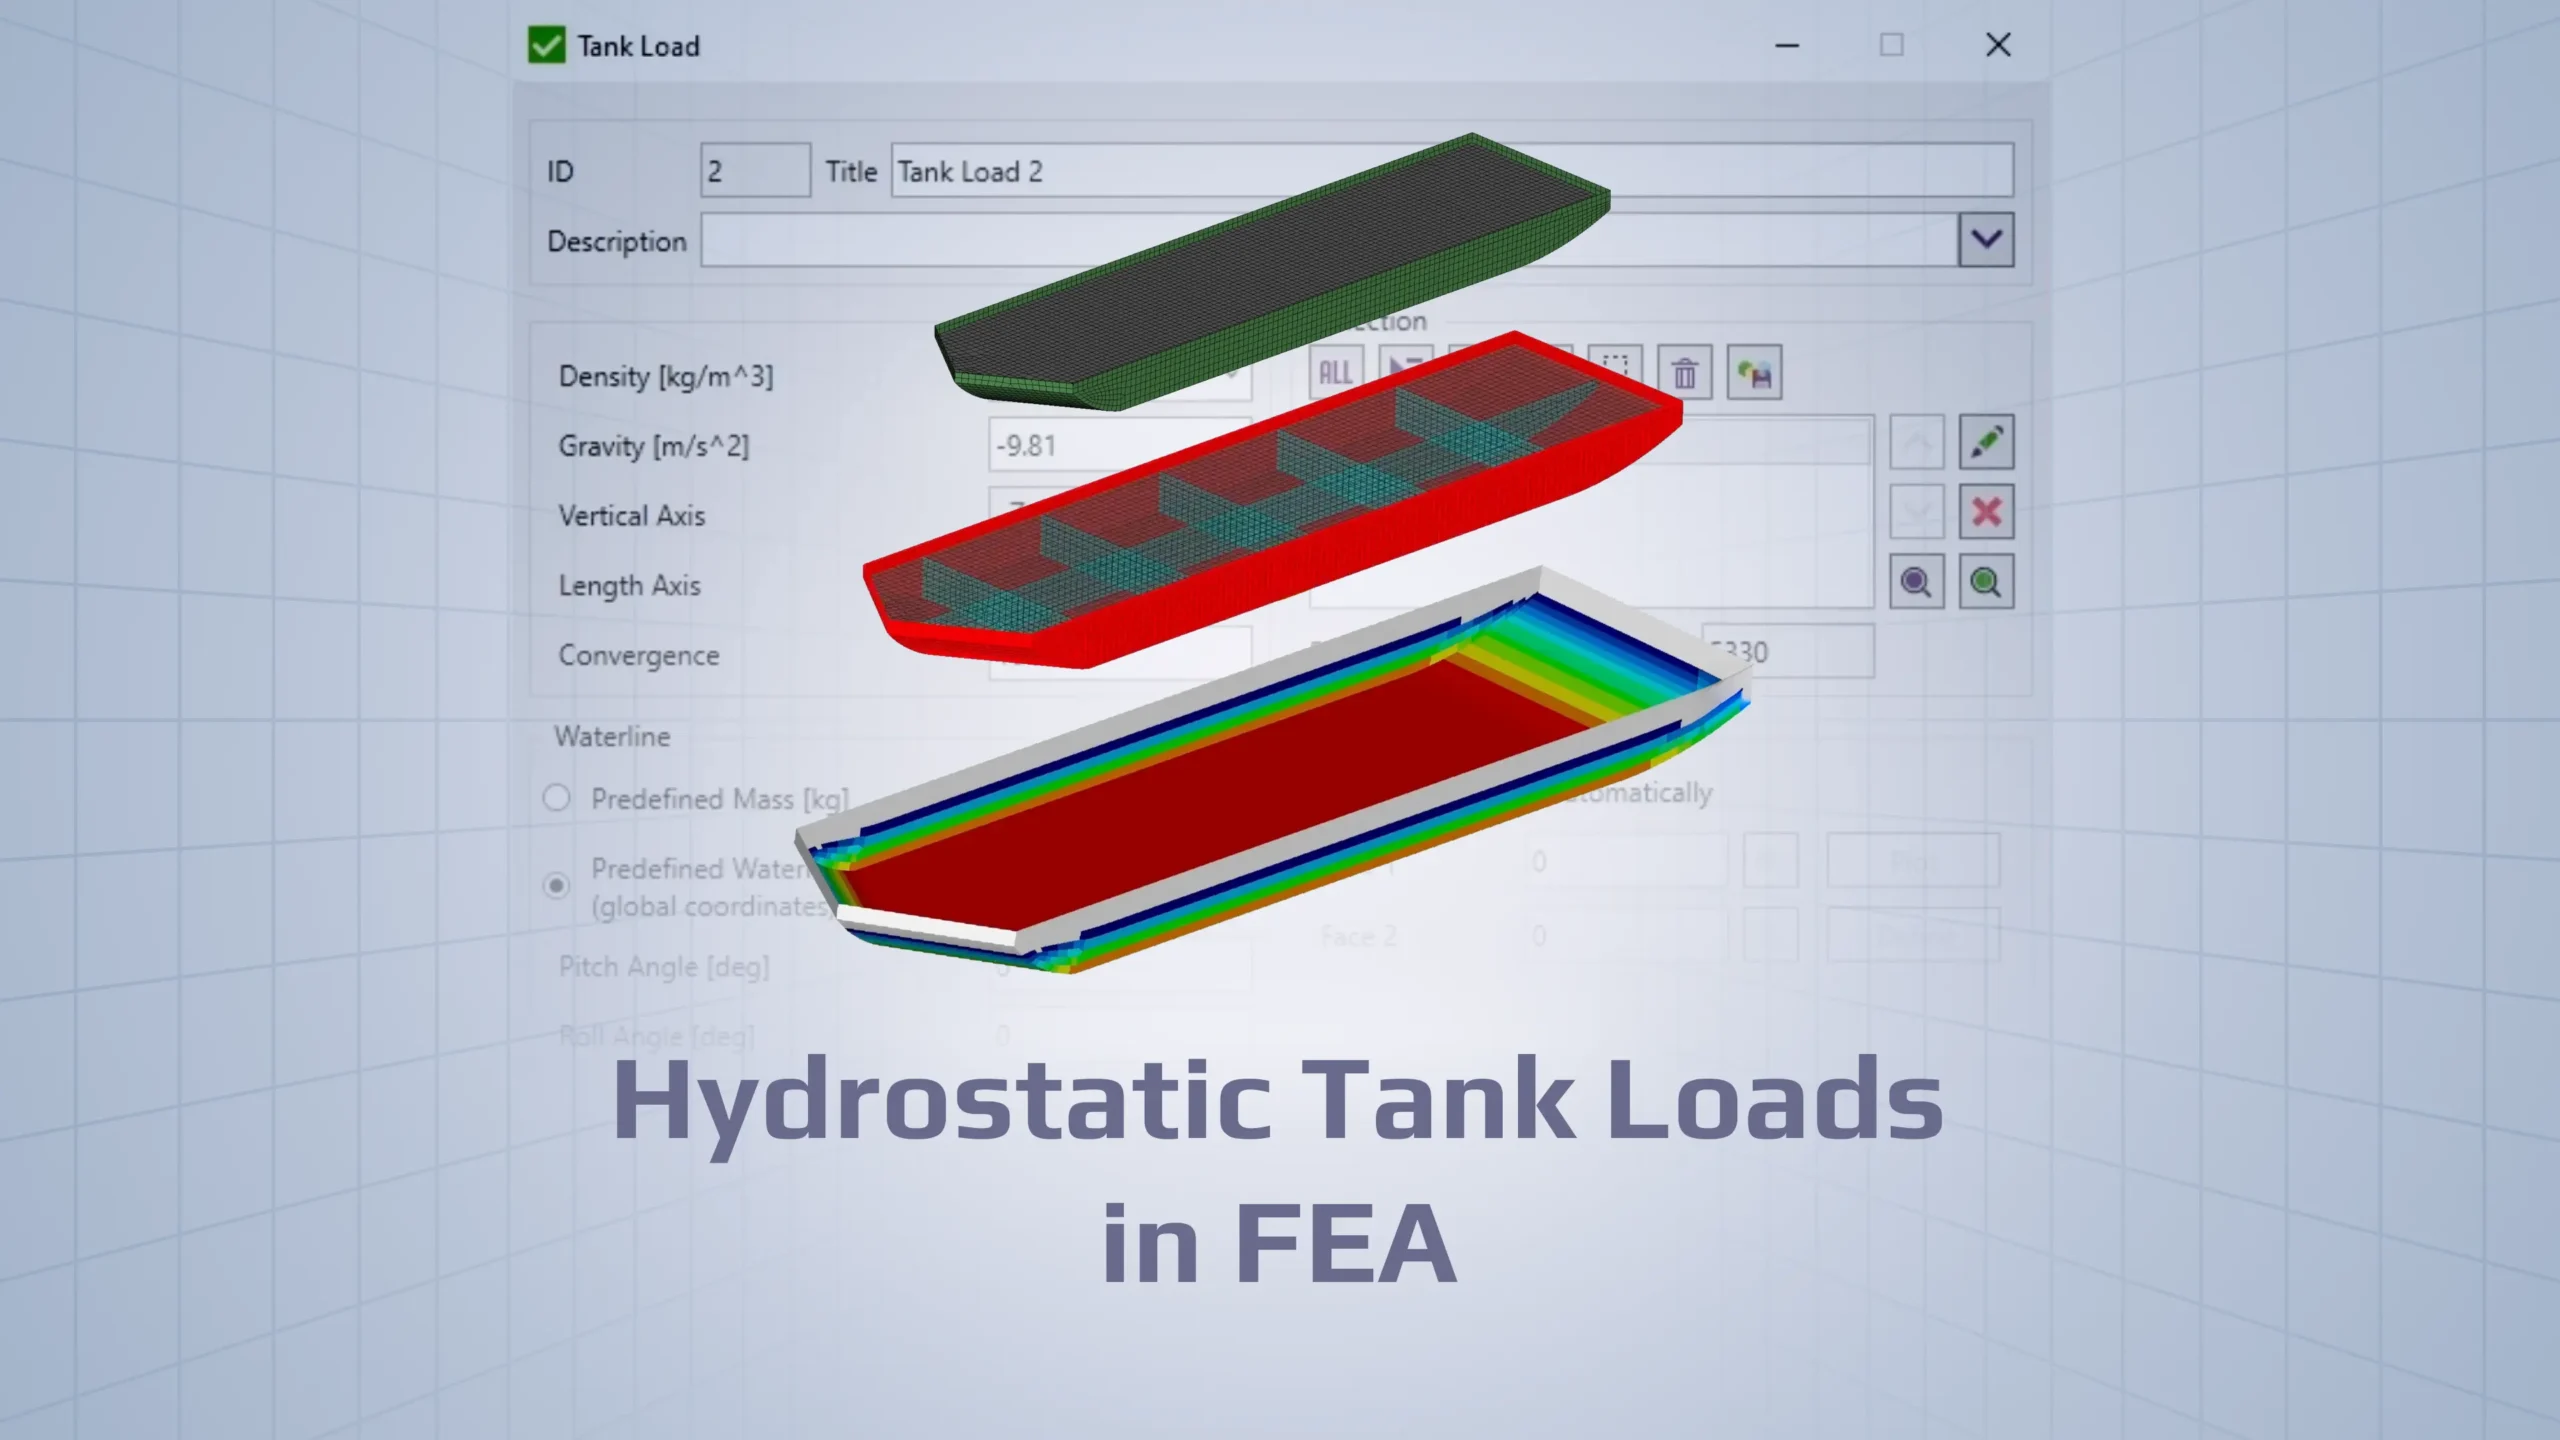
- Realistic Load Scenarios: Common load cases include buoyancy forces, wave pressure, wind loads, and distributed weights. Each load is applied based on the ship’s operational profile and environmental conditions.
- Automation for Efficiency: Automating load application, especially repetitive scenarios like wave or tank pressure, reduces time and ensures consistency. Parameters like wave height or wind pressure can be predefined, enabling rapid application across the model.
Tip: Engineers can define templates for load cases (e.g., wave pressure variations) and apply them programmatically across the entire structure.
- Combination Management: Standards like ABS and DNV often require analysis under multiple load combinations. Automated systems can generate these combinations and ensure every regulatory scenario is addressed.
Structural Recognition
Efficient verification depends on accurately identifying and categorizing structural elements:
- Automated Recognition: Panels, plates, stiffeners, and welds are identified with minimal manual intervention, saving time and reducing errors.
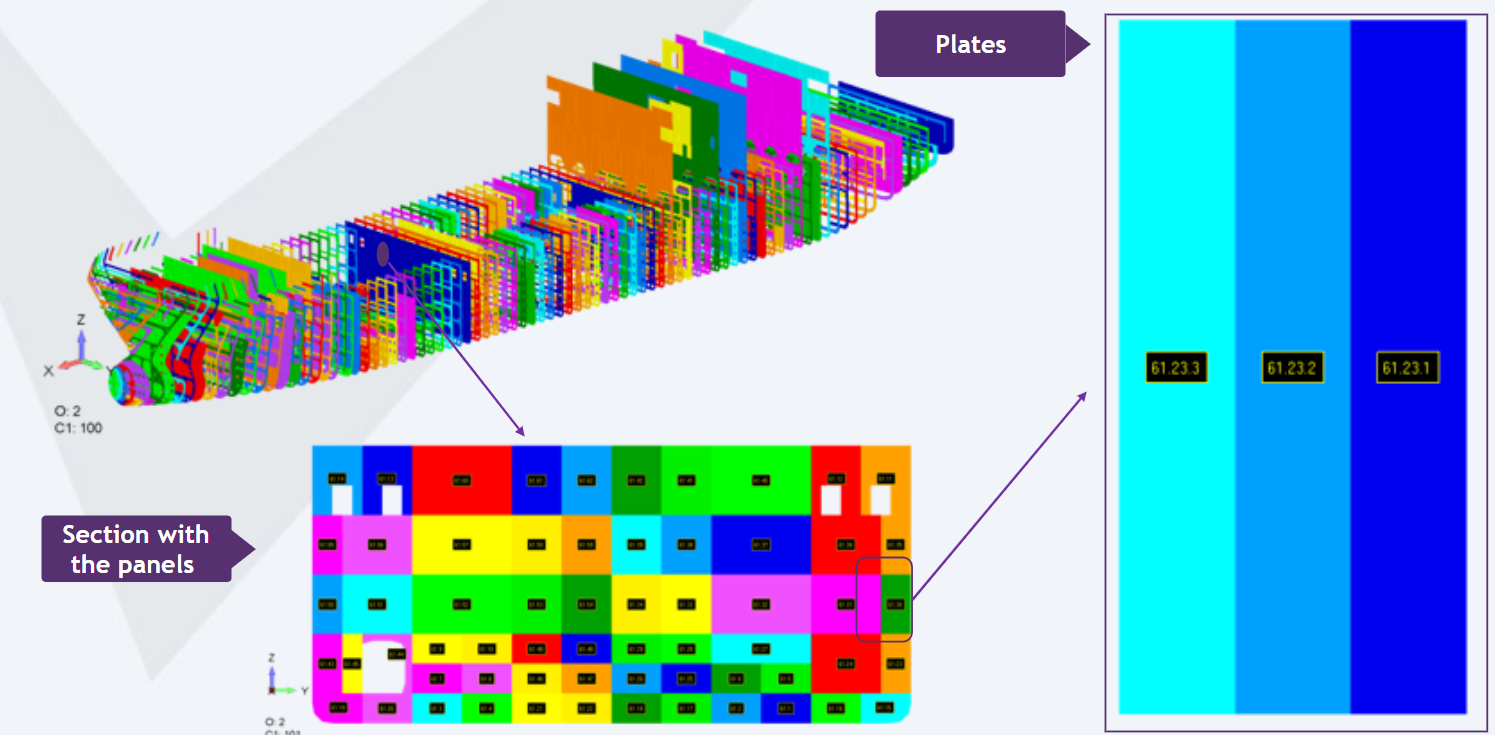
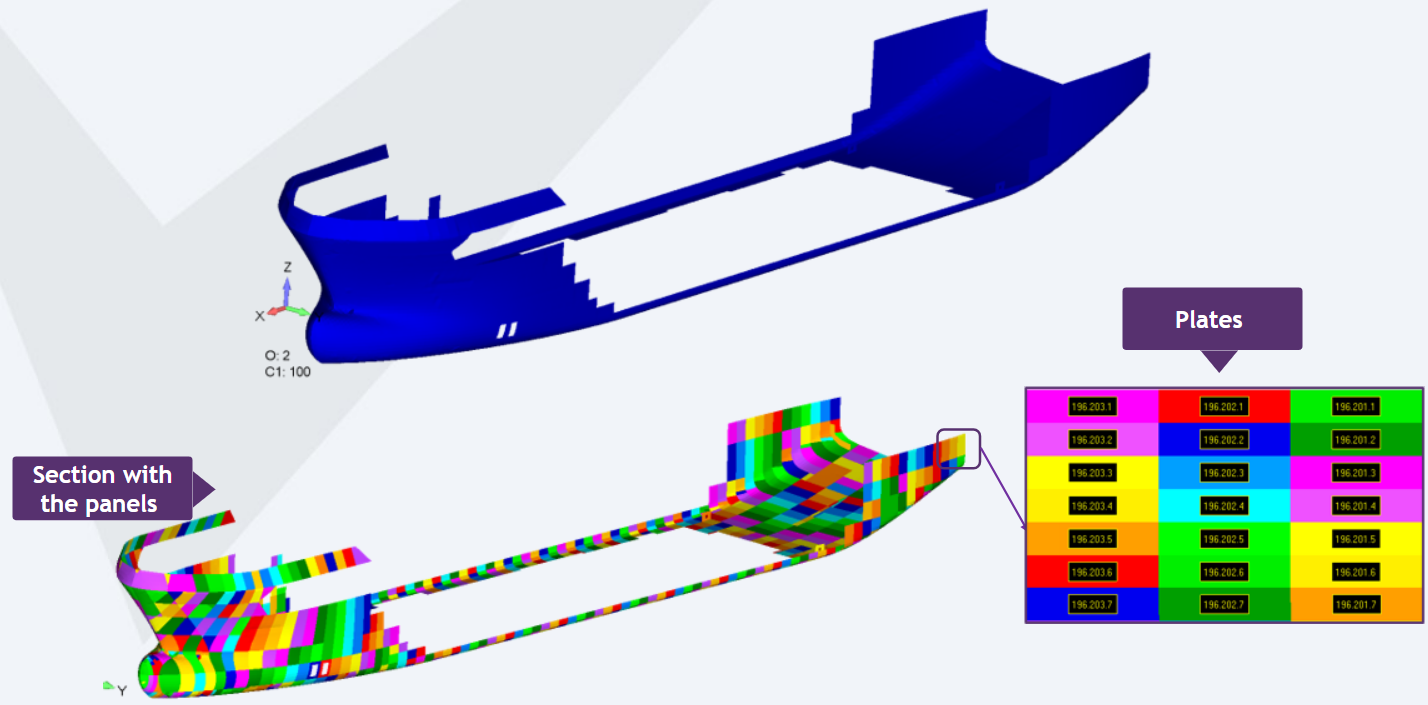
Using the Panel Finder, engineers can identify frames in the X-direction (frames), Y-direction (longitudinals), Z-direction (decks) or custom sections (which don’t lie in the plane of the global coordinate system). This ensures comprehensive evaluation of vertical, longitudinal, and transverse stresses.
Watch how Panel Finder automatically recognizes sections, panels, plates, and stiffeners for streamlined Plate/Stiffener Buckling Checks, demonstrated using a ship model.
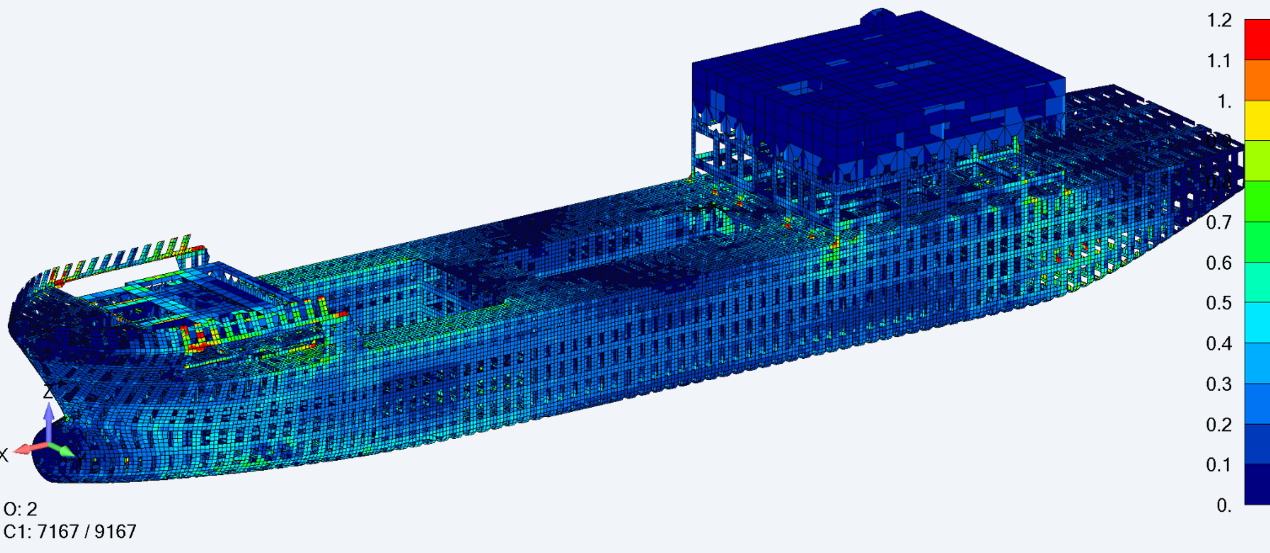
For example, when recognizing ship structures, frames in the X-direction are identified along with their individual panels and plates. The detailed breakdown simplifies the application of buckling and fatigue checks, ensuring that all structural components are accounted for systematically.
Image: Recognition of frames in the X-direction: Panels and plates identified within individual sections for precise verification.
Similarly, for longitudinal sections in the Y-direction, the recognition process identifies individual panels and plates, organizing them into distinct sections. This ensures seamless application of standards for longitudinal stresses and fatigue checks.
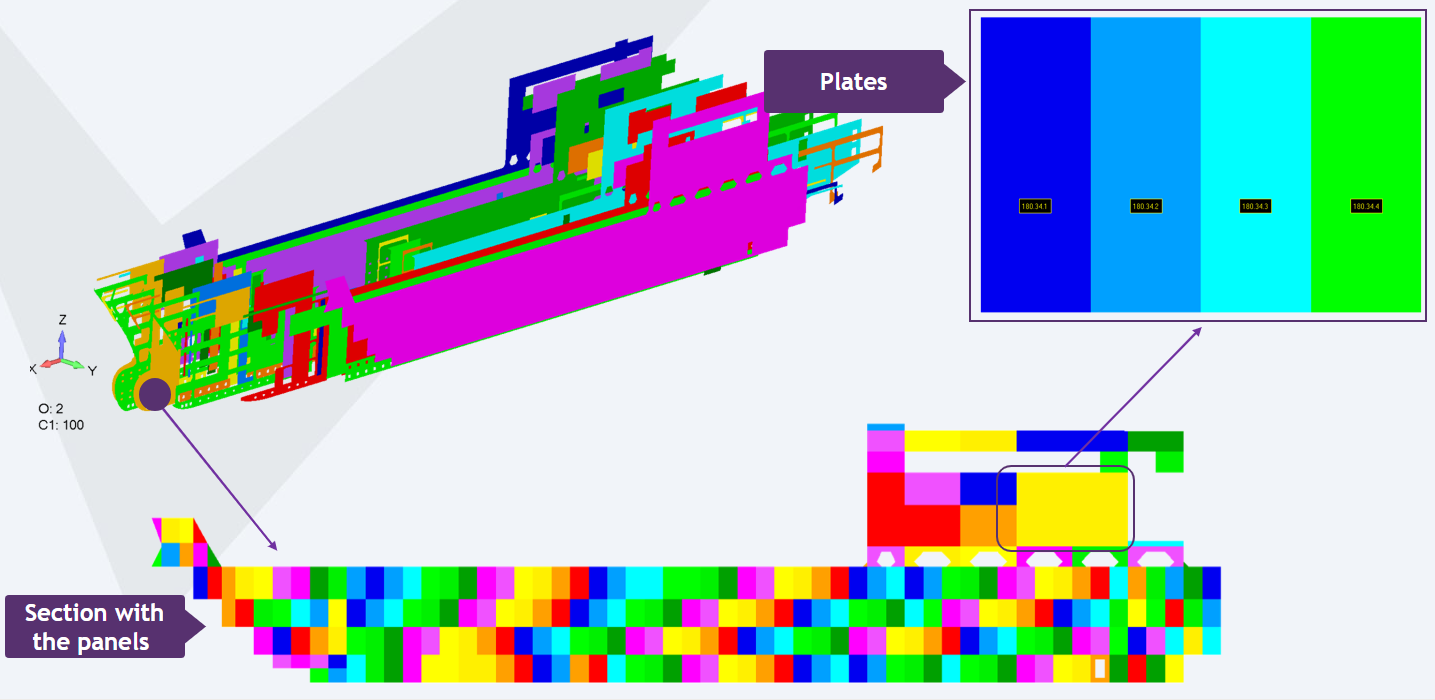
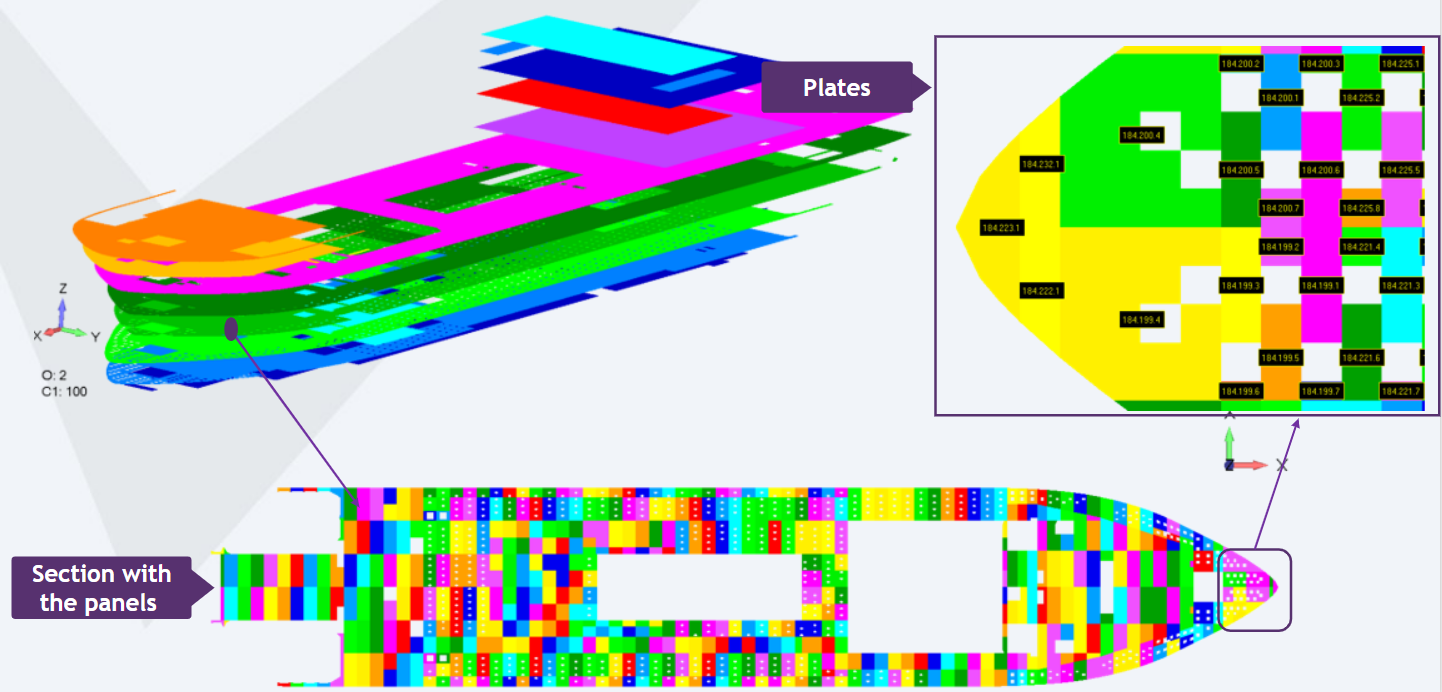
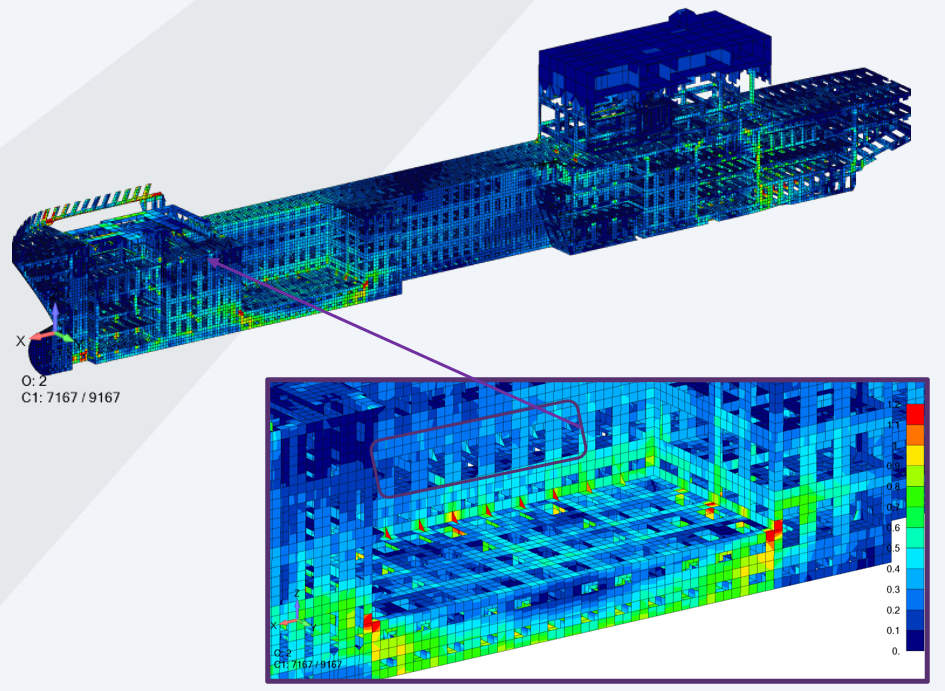
In addition to X and Y directions, the recognition process also organizes decks in the Z-direction, identifying panels and plates essential for evaluating vertical loads and buckling resistance. This comprehensive recognition ensures that all structural aspects of the vessel are accurately verified.
Image: Recognition of decks in the Z-direction: Panels and plates categorized for accurate analysis of vertical stresses and structural stability.
In addition to standard X, Y, and Z orientations, the recognition process can handle custom directions. This capability is crucial for complex geometries where structural elements are not aligned to global axes, ensuring all panels and plates are accounted for accurately.
Image: Recognition of sections in a custom direction: Panels and plates identified for precise analysis in non-standard geometries.
- Detailed Categorization: The software can distinguish between primary and secondary structural members, ensuring appropriate standards are applied.
- Weld Intersections and Stress Concentrations: High-stress zones, such as weld intersections, are automatically flagged for detailed analysis, providing engineers with actionable insights on potential weak points.
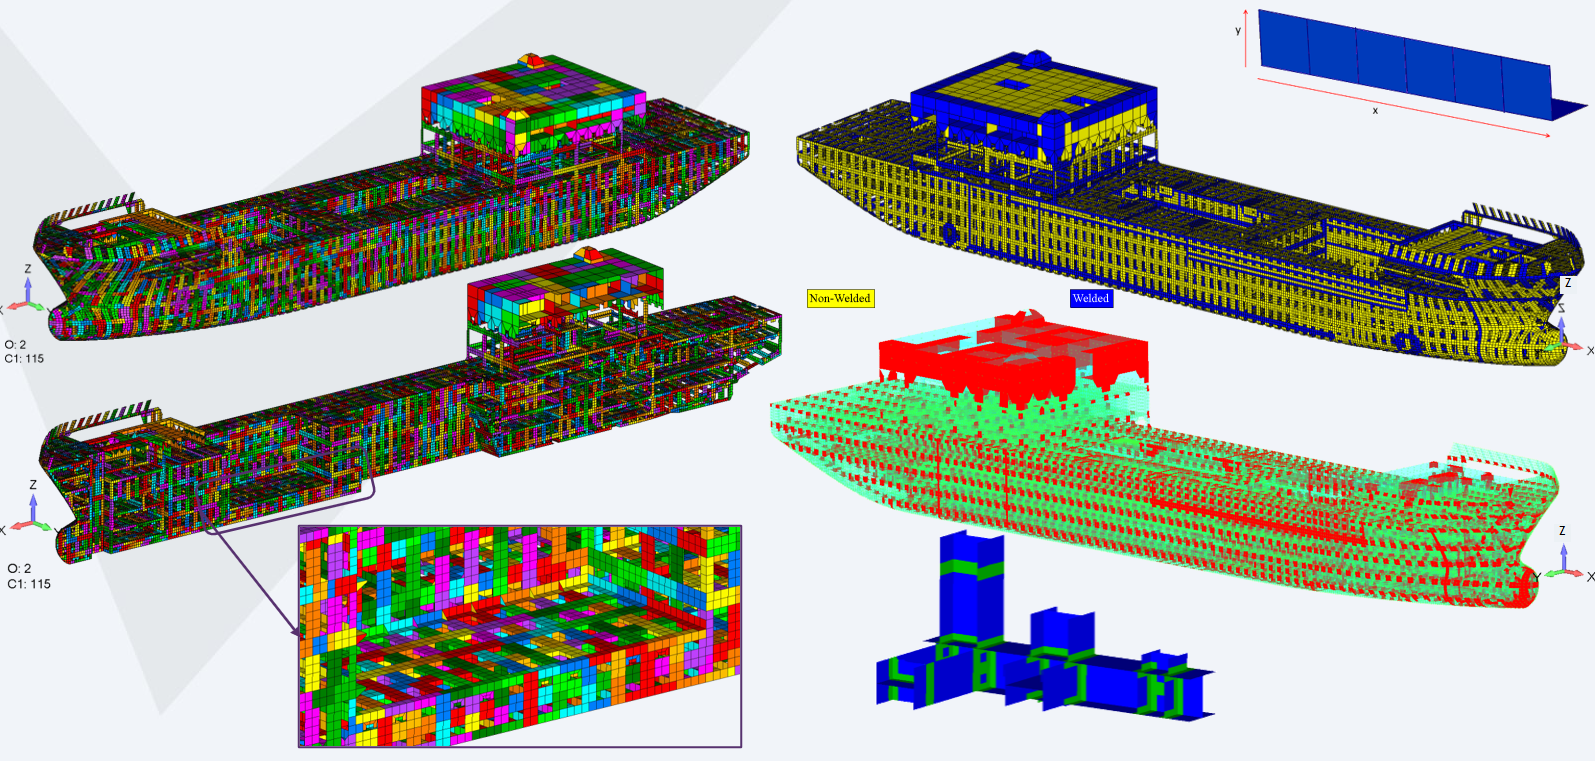
The Weld Finder tool is particularly useful for identifying and categorizing welds across a structure. This automated process recognizes intersections, tracks stress concentration points, and ensures accurate input for fatigue and strength verifications. Below is a video demonstrating the tool in action.
Video: Watch how the Weld Finder tool automatically identifies welds, intersections, and stress points, streamlining the verification process for ship structures.
Below is an example of how the Weld Finder tool automatically identifies all welds and reorients internal stresses to the local weld coordinate system. The tool even handles complex intersections and excludes specific welds, such as those in rolled sections, when necessary.
Illustration of the Weld Finder tool: Automatic identification of welds, reorientation of stresses, and handling of weld intersections and exclusions for rolled sections.
ABS and DNV Standards in Action
By applying these standards to real-world scenarios, engineers can address critical challenges like plate buckling and fatigue with precision and reliability.
Plate Buckling Verification
Global vs. Local Buckling Checks:
- Global Buckling: Evaluates the overall stability of structural components under compressive stress, focusing on large-scale deformation risks.
- Local Buckling: Examines smaller regions within the structure, such as individual plates, for localized failures that may propagate into broader structural issues.
Verification Methods:
- Element-Based Approach: This method calculates stress distribution at the element level, capturing local variations and identifying high-risk areas like stiffeners and weld intersections.
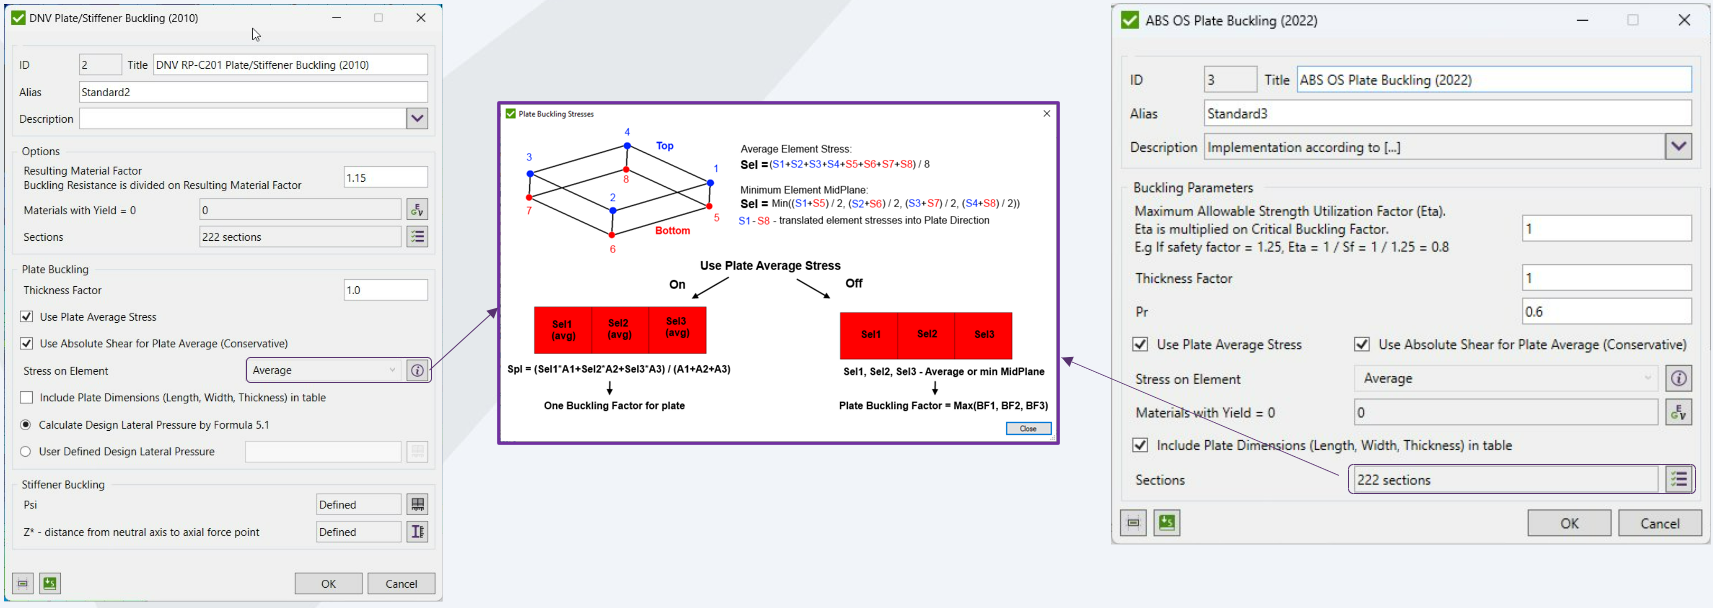
Standards such as DNV and ABS provide detailed settings for plate buckling checks, enabling engineers to customize parameters like material yield, thickness factors, and stress ratios. These settings allow for adjustments to accurately reflect real-world conditions without needing to reanalyze the entire model.
Configuration of DNV and ABS standards for plate buckling checks, showcasing options for stress transformation, yield stress definition, thickness adjustments, and proportional elastic limits.
- Average-Stress Approach: Provides an aggregated view of stress across larger structural components, ideal for assessing overall buckling resistance.
Standard Settings for Plate Buckling
Both ABS and DNV standards provide detailed settings for plate buckling checks, allowing engineers to customize parameters for specific conditions.
Example Settings:
- Material Yield Stress: Define or adjust yield values for specific materials.
- Thickness Factor: Scale plate thickness without requiring reanalysis.
- Stress Transformation: Automatically reorients stresses to align with the plate direction.
Challenges Addressed:
- Material Properties: Variations in yield strength and material behavior are incorporated into buckling calculations, ensuring accurate representation of structural limits.
- Thickness Variations: Regions with reduced plate thickness due to design constraints or corrosion are factored into the analysis, allowing for realistic safety assessments.
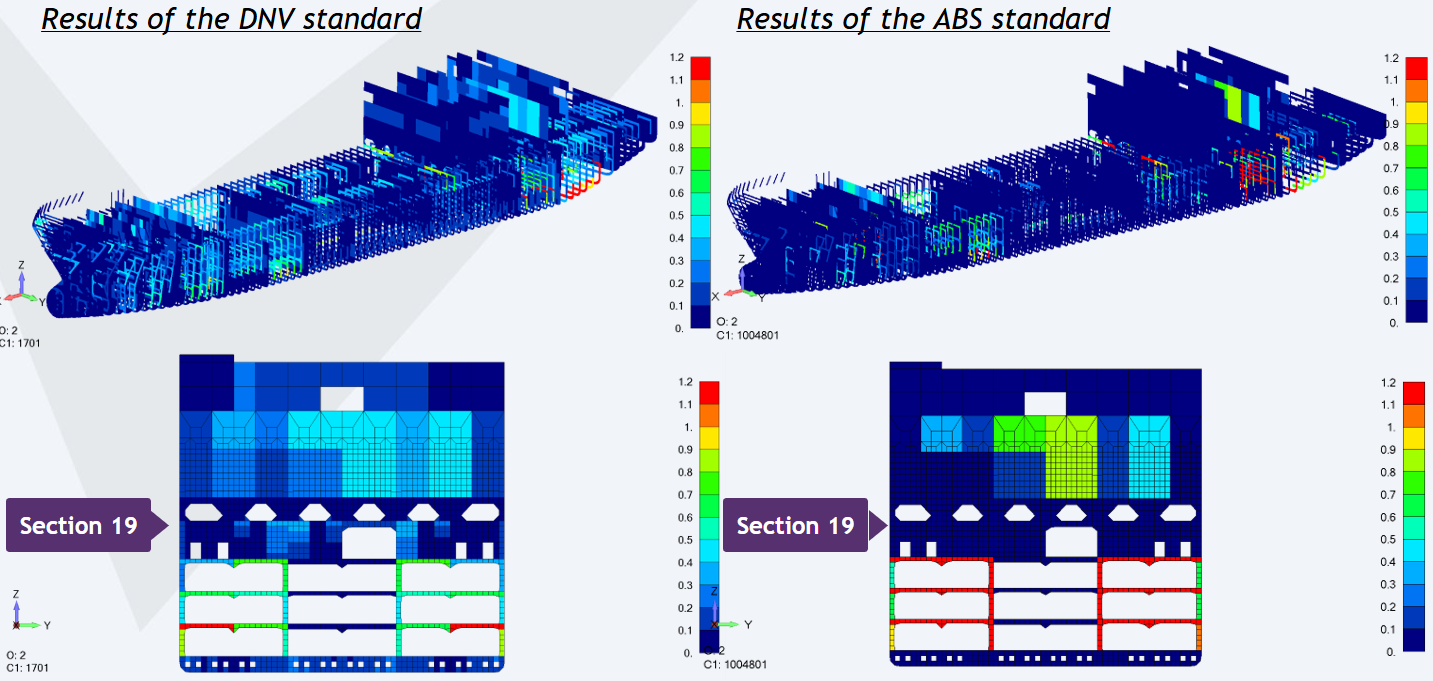
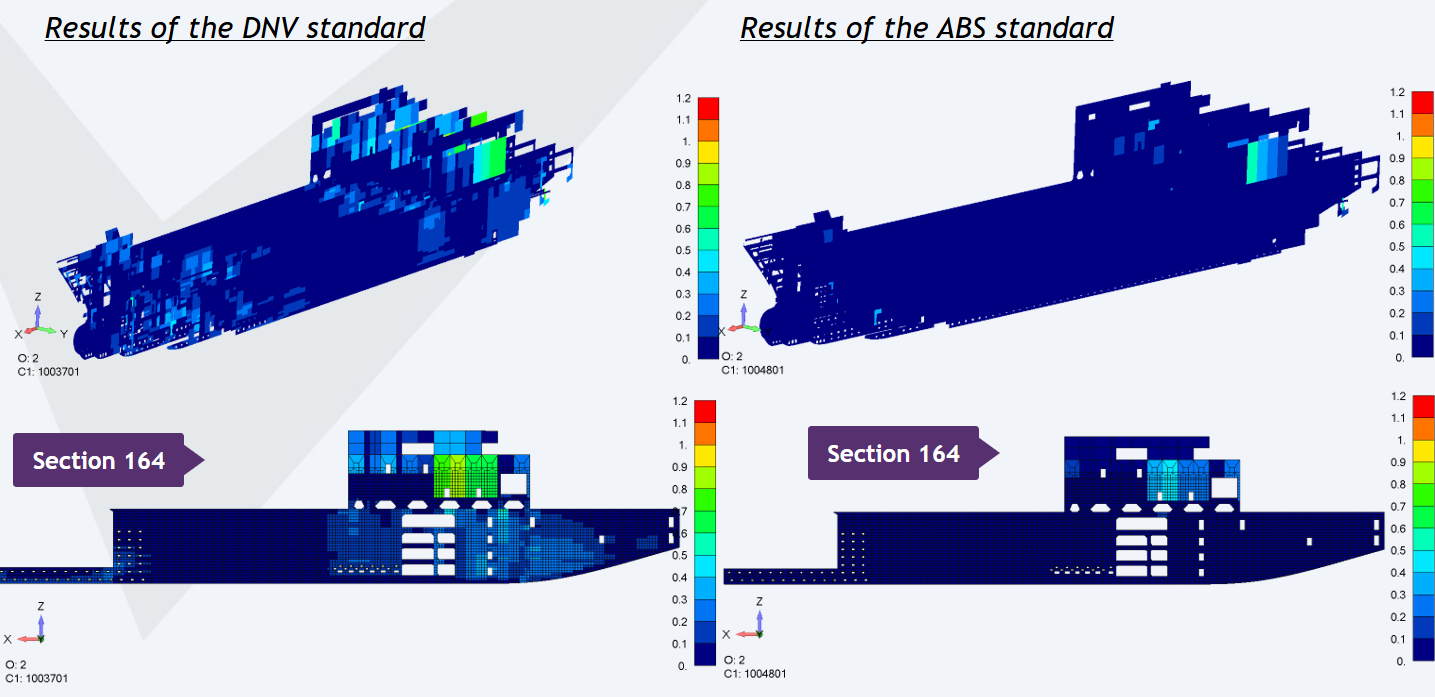
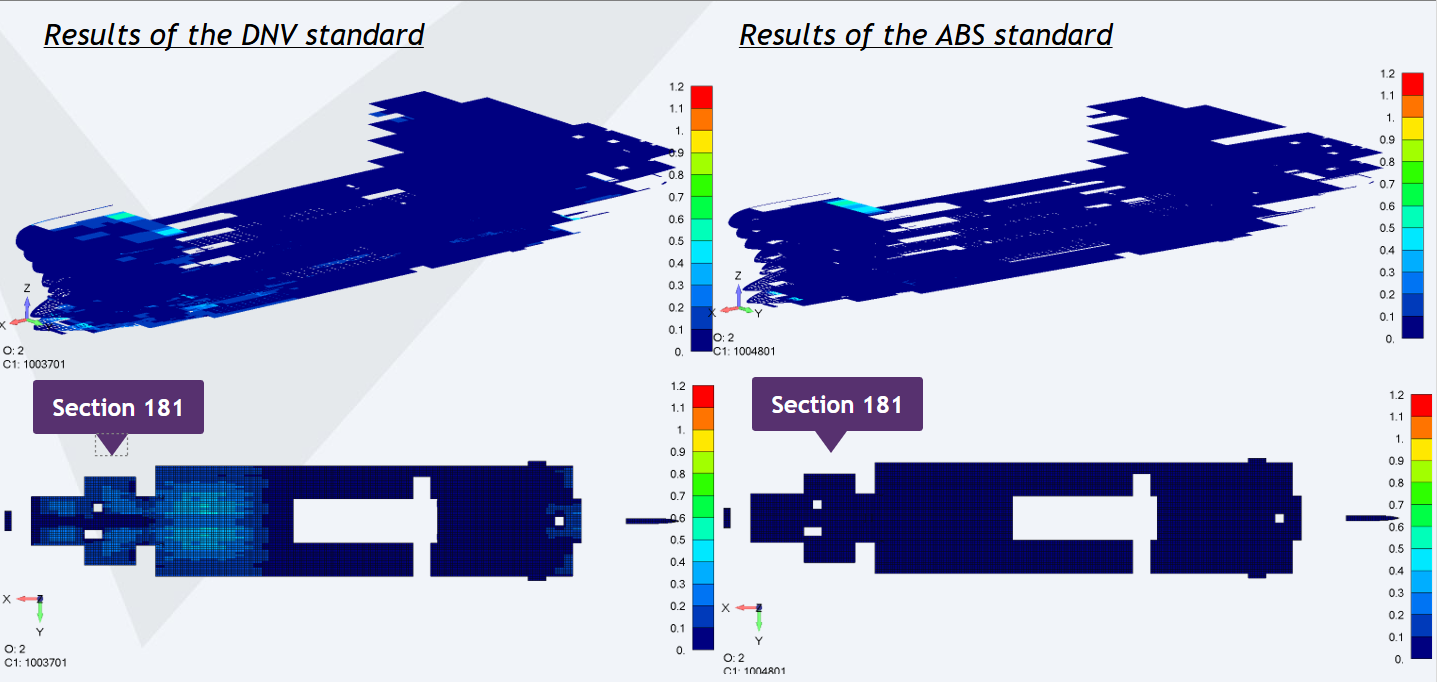
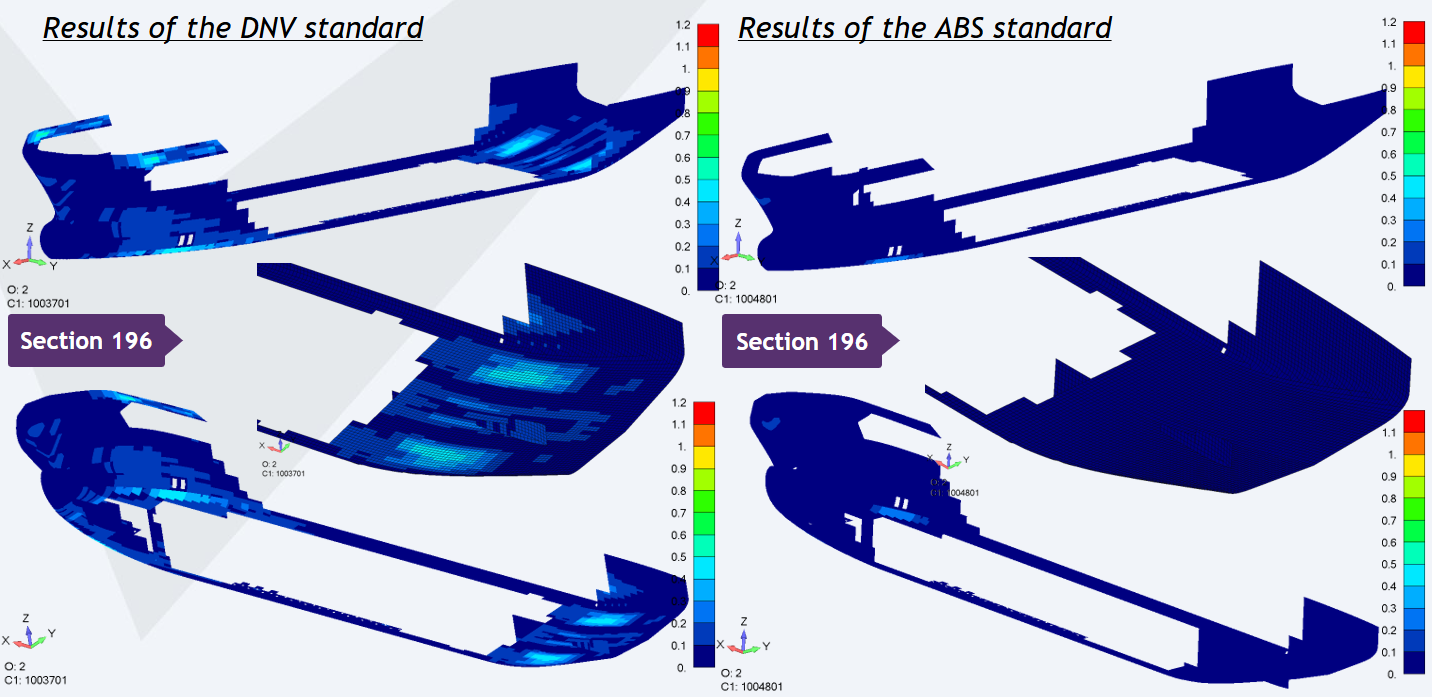
The results of plate buckling verification vary depending on the standard applied. Below is a comparison of outcomes using the DNV and ABS standards. The visualized data highlights how material factors, load combinations, and stress calculations influence the analysis results.
|
|
|
|
|
|
Comparison of plate buckling results: DNV and ABS standards applied to the same ship model, highlighting differences in load effects and stress distribution.
- Corrosion Impact: Safety factors can be adjusted to simulate different corrosion scenarios, enabling engineers to evaluate residual structural capacity over time.
Fatigue Verification
SN Curve Assignments:
- Environmental Considerations: Fatigue analysis adapts based on whether components operate in air or sea environments, as these significantly impact fatigue performance. SN curves are selected accordingly to represent stress-life relationships accurately.
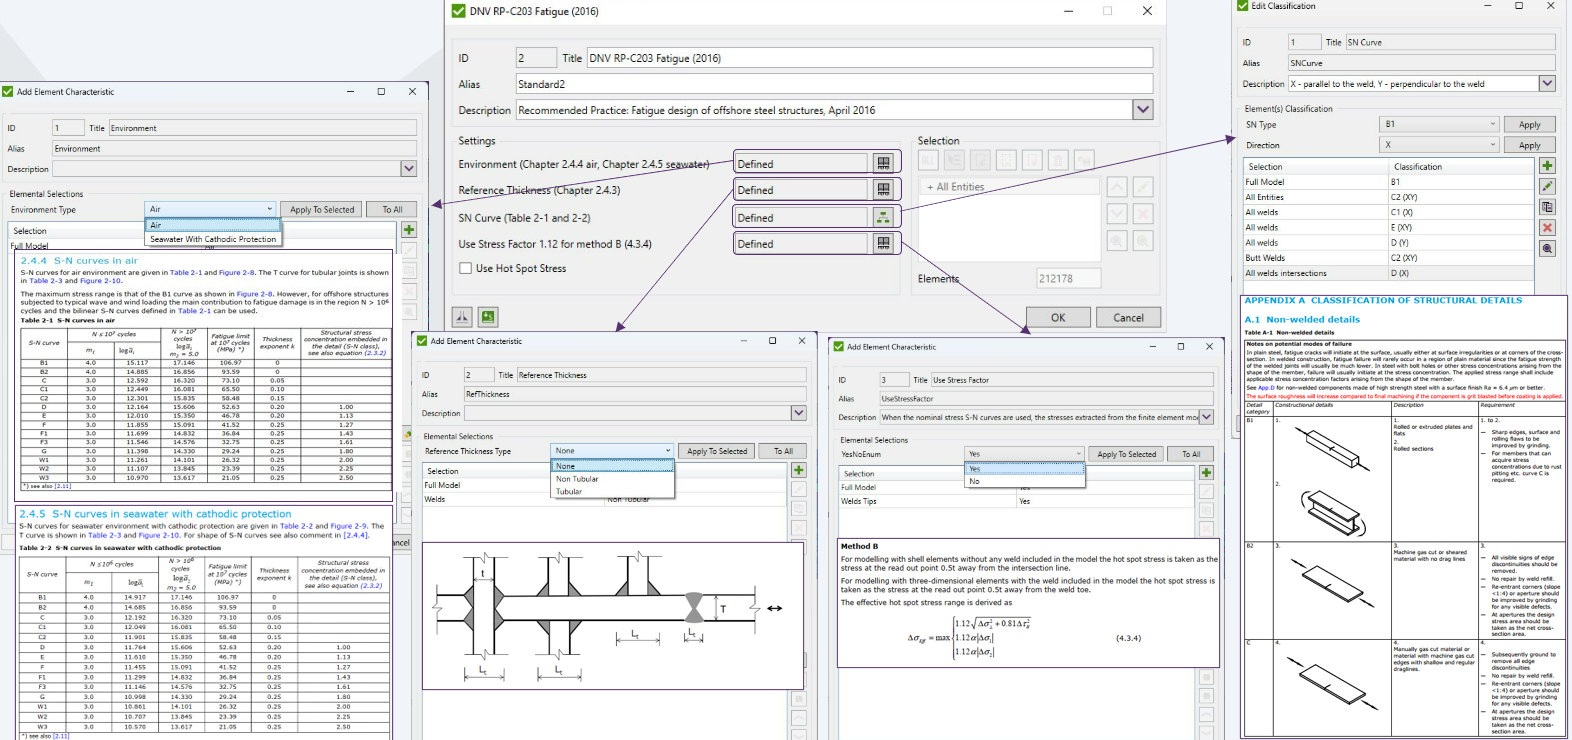
The DNV RP-C203 Fatigue standard provides engineers with detailed settings to ensure accurate fatigue verification. These settings include the assignment of SN curves, reference thickness types, and stress factors, tailored for specific environmental and structural conditions. Below is an example illustrating the available options and configurations.
Configuration of DNV RP-C203 Fatigue (2016) settings: Options for SN curves, reference thickness, stress factors, and classification of structural details.
Incorporating Notch Classes:
- Real-World Simulations: Welds and structural intersections are assigned notch classes, reflecting actual conditions where stress concentrations are highest. This ensures fatigue predictions align with real-life operational stresses.
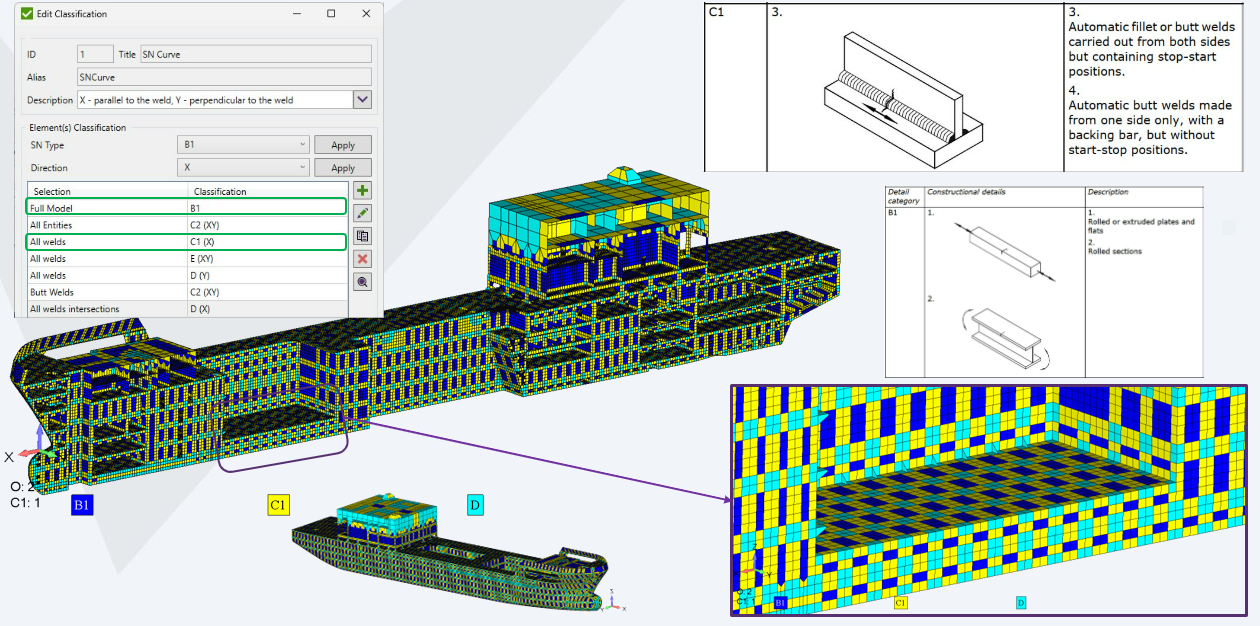
Weld classification plays a critical role in fatigue verification. By assigning SN curves based on weld orientation and quality, engineers can account for directional strength variations, such as those parallel to the weld (X direction). The visualization below shows the classification process and the distribution of weld strength across a ship structure.
Weld classification for fatigue verification: SN curve assignments based on weld direction (X) and structural details, ensuring accurate fatigue analysis.
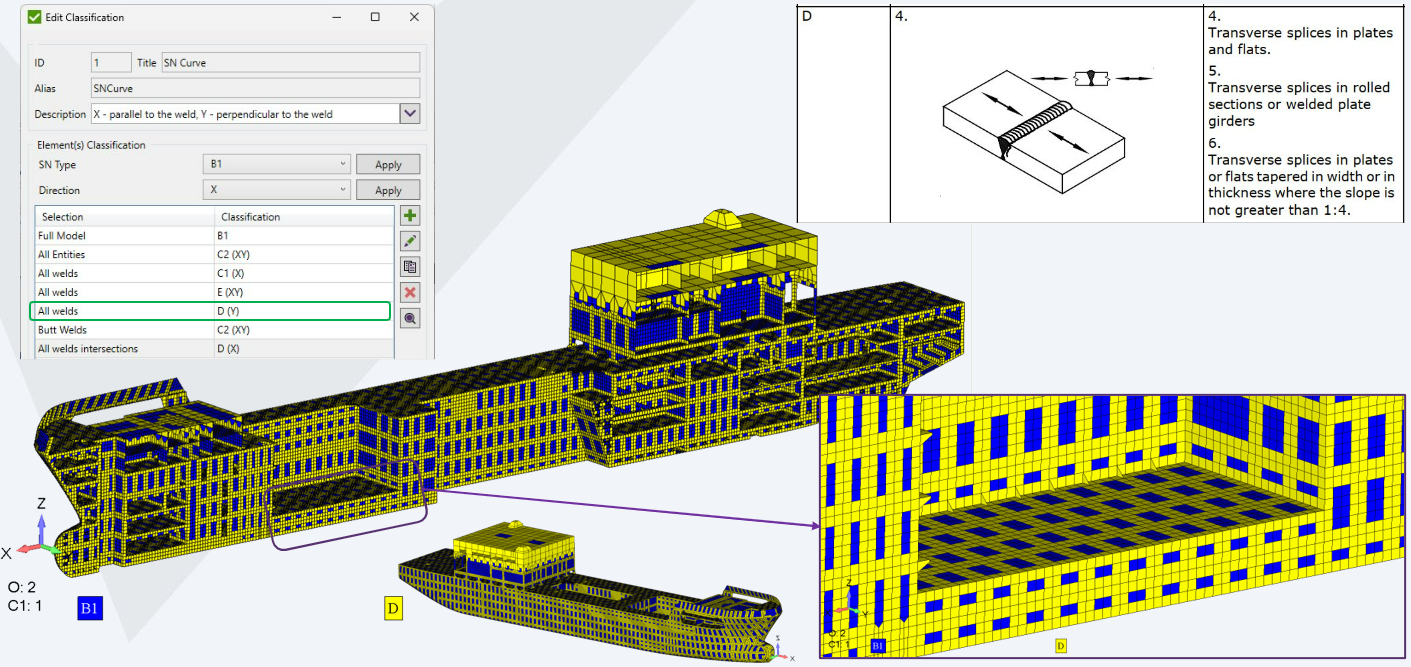
Similarly, weld classification for the Y direction (perpendicular to the weld) is critical for analyzing fatigue performance in regions experiencing transverse stress. The following visualization highlights the classification process and the associated SN curve assignments for this orientation.
Weld classification for fatigue verification: SN curve assignments based on weld direction (Y) and structural details, ensuring accurate fatigue analysis.
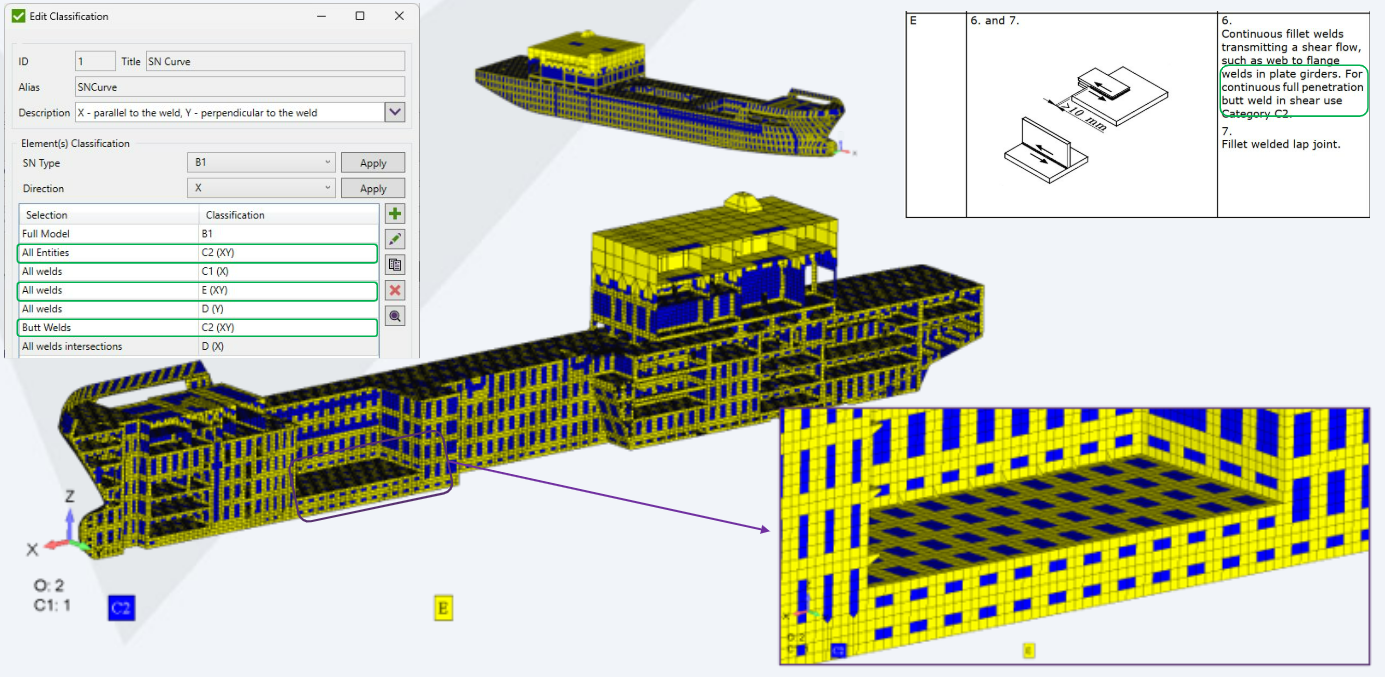
In addition to X and Y directions, the shear flow in the XY plane plays a significant role in determining weld strength under complex loading conditions. Below is a visual representation of SN curve classification and weld strength in the XY direction, including critical details for fillet and butt welds.
Weld classification for fatigue verification: SN curve assignments and weld strength distribution in the XY direction (shear flow), including details for fillet and butt welds.
- Directional Assignments: Different notch classes can be applied for directions along, across, or perpendicular to welds, capturing directional dependencies in fatigue performance.
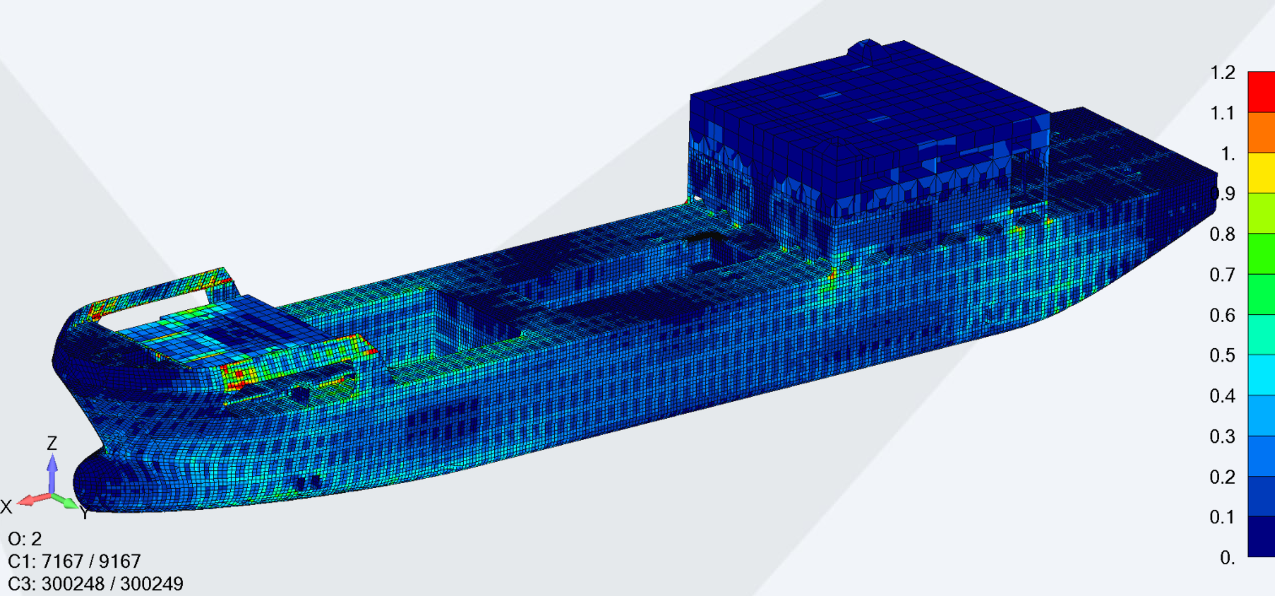
The following images illustrate the fatigue verification results according to the DNV standard. These visualizations provide a detailed stress distribution, highlighting critical fatigue-prone zones
|
|
|
|
From Analysis to Actionable Results
Converting technical analyses into actionable insights is the ultimate goal of structural verification. Automation plays a pivotal role in bridging the gap between raw data and engineering decisions, empowering engineers to act with confidence and precision.
Automated Reporting: Turning Data into Insights
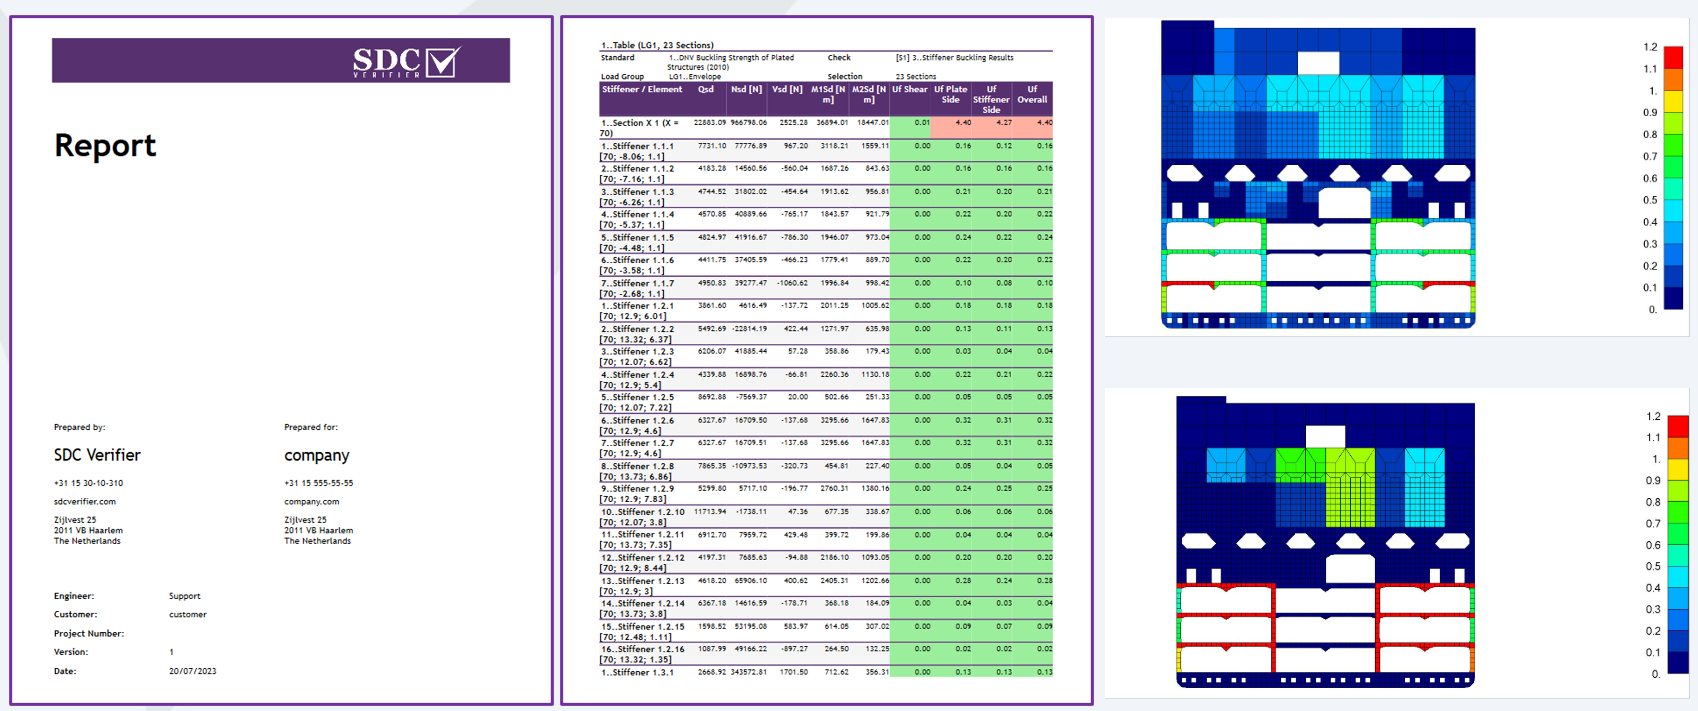
Automated reporting enables engineers to translate analysis results into actionable insights. The following example demonstrates how plate and stiffener buckling results are visualized and compiled into comprehensive reports for efficient decision-making
Automated buckling report: Detailed tabular data and stress distribution maps ensure actionable insights for engineers.
Visualization of Results:
Automated reporting transforms numerical outputs into clear, intuitive visualizations, enabling engineers to:
- Identify areas of concern, such as plates, panels, and welds, at a glance.
- Analyze color-coded stress distributions across the structure, highlighting regions that exceed safety thresholds.
- Zoom in on specific components or weld intersections to understand localized stress concentrations.
Critical Area Analysis:
Reports emphasize high-stress zones, particularly:
- Stress Concentration Points: Areas with abrupt geometric changes or load variations, often leading to potential failures.
- Weld Intersections: Known for being structural weak points, these are flagged for further investigation and fatigue assessments.
Standards Comparison:
Automated tools allow side-by-side evaluations of compliance outcomes for multiple standards, such as ABS and DNV, enabling engineers to:
- Understand how different standards affect design constraints and safety margins.
- Ensure that all required criteria are met, even when standards diverge in methodology or safety factors.
Maintaining an Engineering Audit Trail
Facilitating Inspections and Reviews:
An audit trail ensures that every stage of the verification process is documented and reproducible, streamlining:
- Inspection Processes: Inspectors can reference detailed verification data, including material properties, loads, and results, to validate compliance.
- Project Reviews: Historical data simplifies revisiting past designs or addressing regulatory inquiries.
Delivering Reliable Results to Stakeholders:
A well-maintained audit trail instills confidence among stakeholders by providing:
- Transparency: Clients and regulators can access clear, verifiable records of compliance efforts.
- Consistency: Engineers can demonstrate that verification practices adhere to industry standards across projects.
By combining automated reporting with a robust audit trail, engineers can bridge the gap between analysis and application. The result is a streamlined workflow that not only ensures compliance but also facilitates informed decision-making at every stage of a project.
Expertise + Automation = Results
Automation is not a replacement for engineering expertise but a powerful complement. Engineers bring critical insights, applying their knowledge to interpret results, validate assumptions, and ensure compliance. Automation enhances this by streamlining workflows, reducing errors, and ensuring consistency. Together, they form an unbeatable combination for achieving accuracy and efficiency in ship design verification.
As the maritime industry continues to evolve, the ability to blend technical proficiency with advanced tools will define the success of engineering teams. By embracing these approaches, engineers can meet the demands of modern ship design with precision, confidence, and efficiency.

