


Structural Components based verification process for FEA models
Chris Teague
Saratech, USA
Wouter van den Bos
Delft University of Technology, Netherlands
Introduction
Once a finite element model is run to generate displacements, loads, and stress contours, you often need to further process the data to check against industry standards criteria such as beam and plate buckling, joint analysis, fatigue life calculations, and in-house custom checks. Then you may need to create a report documenting the model and margins of safety with both tables and model plots. This can be a very tedious and time-consuming process the first time it is done. But with changes to the design, updated load conditions, and other adjustments to the finite element model, it can be a dramatic time saver if we can automate this process. Plus the automation can help reduce mistakes, since once the automation template has been verified, then you can continue to reuse that template every time the finite element model is updated.
A newly developed software tool SDC Verifier uses a new method to automate this process. With it’s so-called “recognition tools” dimensions and orientation of structural components as plates, stiffeners, bulkheads, welds, beam members or columns are identified in the FEA model and the complete shape and size of the structural components are automatically retrieved. Because it is only based on the element and nodes description it doesn’t matter whether the model comes from NX Nastran, MSC Nastran, NEi Nastran, Ansys, Abaqus, or LS-DYNA3D.
Figure 1 shows this new workflow, starting with beam member recognition, plate recognition, joint and weld recognition, which can feed data into the checking module, and then finally into a report. We will review this new process which automatically recognizes features such as beam length, joints, panels, and feed this data into formulas for beam and plate buckling, fatigue, joints analysis, and other industry standard checks that need to be made in order to complete the analysis on a part. These results can then be automatically seen into a fully customizable reporting wizard to automate the creation of a final report.
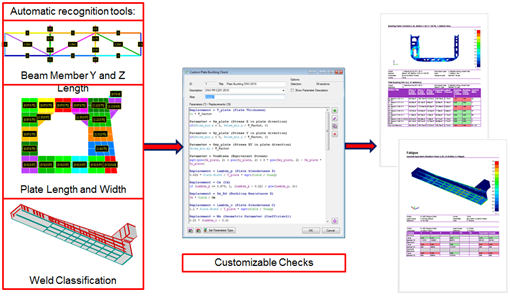
Figure 1: Workflow from feature recognition to checks to final report
The recognition tools use a unique automation method to automatically find the length of a beam member used in the buckling calculations, the height and width of the plate features, and the location and orientation of the welds. This can be a dramatic time savings over the more common manual calculations of each of these features. These algorithms have been used successfully on models with thousands of individual features.
Automated Recognition tools
Many finite element programs will return the length of a bar/beam element, but for buckling and other checks, we usually need the full length of the member from joint to joint, not just the individual element length. Finite element programs do not have this data, so either we have to manually enter the data into custom programs, or we have to model the structure using just one element from joint to joint. Neither option is very ideal. The SDC Verifier tool has a built-in algorithm to automatically identify the actual length of an individual beam or column members, no matter how many elements are used. The stiffness directions of joints between beam members are qualified as 1D, 2D, or 3D connections. The type of the connection determines if the beam member is only supported in one principal axis or in both. The effective length can in this way be determined for both the principal axis of the beams. The tool can plot the calculated lengths both graphically and in table form to help verify the accuracy and document the results to be used in the report generator.
Figure 2 shows some results of the automated beam member finding tool, with 2D and 3D joints highlighted.
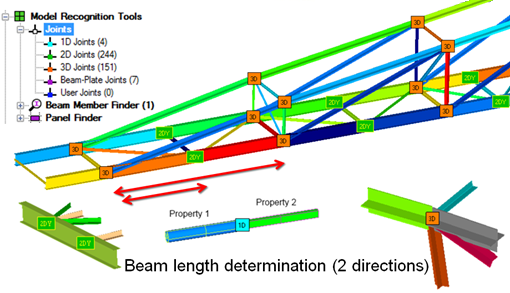
Figure 2: Beam Length Determination and Plotting
Figure 3 shows an example of the beam length plot that shows the calculated beam length for each of the beam members and shows the results in a color plot for reporting and verification. You can easily edit the numbers if you need to input a custom length. And this algorithm is completely independent of mesh density, or FEA Solver brand.
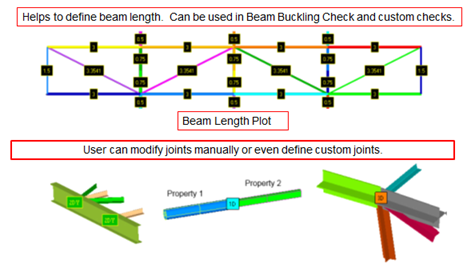
Figure 3: Beam Length Plots
For plate models, the program will find the dimensions of each plate component. This has been tested on models with thousands of plate components as shown in the example in Figures 4 and 5.
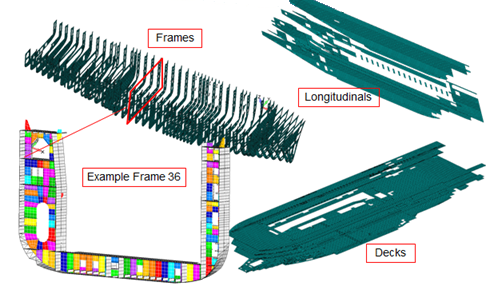
Figure 4: Plate sections
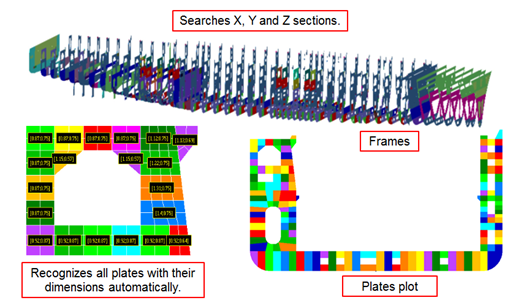
Figure 5: Plate sections with dimensions shown
It is possible to plot the number of elements in each plate station location as shown in Figure 6. This can help verify that the results are accurate.
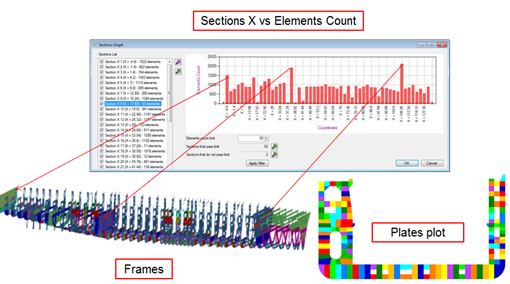
Figure 6: Plate sections station vs. elements count
The weld finder recognizes all welds and updates the weld direction automatically. It can then perform fatigue analysis on the welds. The user has the ability to set the weld type classification for each weld so that the proper calculation can be performed on the different weld types (K0-K4, W0-W2) as shown in Figures 7 and 8. Stiffener and Girder recognition is shown in Figure 9.
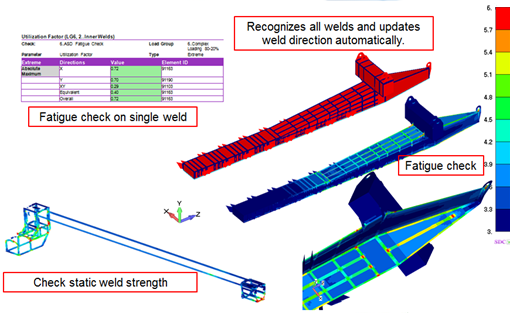
Figure 7: Weld Recognition
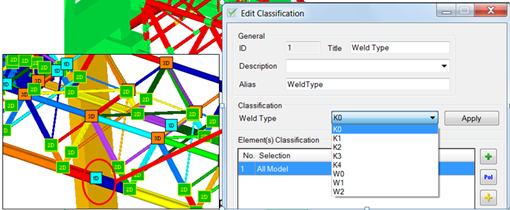
Figure 8: Setting classifications of the Welds
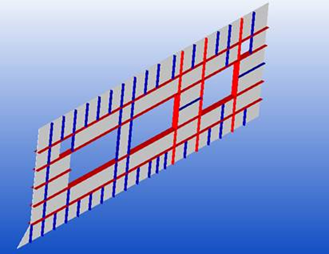
Figure 9: Locating Stiffeners (Blue) and Girders (Red)
Using the results from the automatic recognition tools
With the recognition tools, structural checks can directly be calculated on the structural components instead of on individual finite elements. This makes the tool mesh independent and very flexible. The beam length tool will recognize effective lengths that may be different in the weak or strong orientation. All this info can be automatically fed into the formulas prescribed by national standards or by classification societies such as API, ANSI, AISC, EN, DIN, ABS and DNV codes. Much time is spent on keeping the complete verification process as open as possible, All the formulas used can be seen, updated or customized and new standards can be easily added. Figure 10 shows some of the many parameters that can be edited and changed. Figure 11 shows an example of an AISC Buckling Check being performed on a crane structure, with the elements that fail the buckling check highlighted in red.
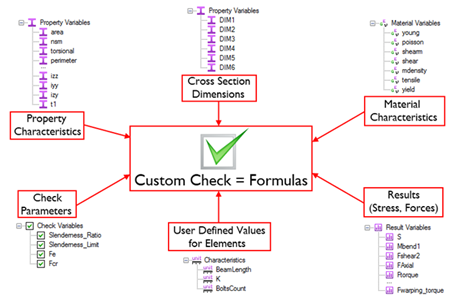
Figure 10: Customizable Options)
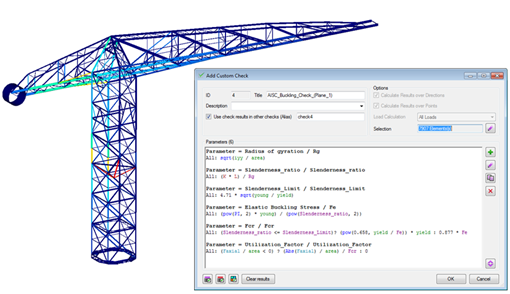
Figure 11: AISC Buckling Check
Furthermore, the documentation of the results is highly customizable; with either a wizard or report designer the full documentation process can be fed to a report containing all necessary info. Model information, size and weight of properties, a total sum of loads and the load combination matrix including tables, graphs and plots are available to the user to add into a report. The menu structure of the report follows the same calculation structure which enables easy browsing afterward. All this can be exported to any popular document format as Microsoft Word or PDF. Figure 12 shows an example of the buckling results in a table format. Many different kinds of tables can be created, and then placed in the report template as desired. For the next set of analysis runs, the tables and charts can be automatically updated.
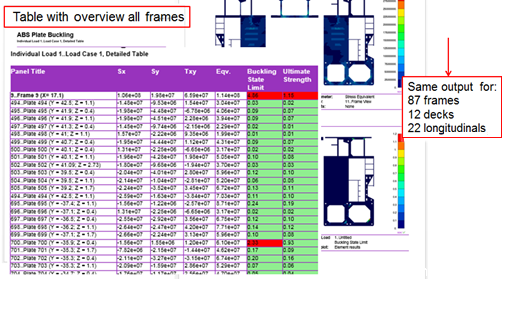
Figure 12: ABS Plate Buckling Check in table format
Designing Reports and Using the Report Wizard
The report wizard process overview is shown in Figure 13. The Report Wizard will guide you through the process of created a report template. Figure 14 shows the model setup information that can be added to the report, including model configuration, analyst and company names, file name, types of elements, loads, boundary conditions, materials and element properties.
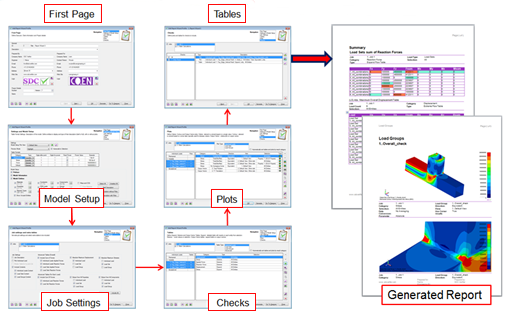
Figure 13: Report Generation with the Report Wizard
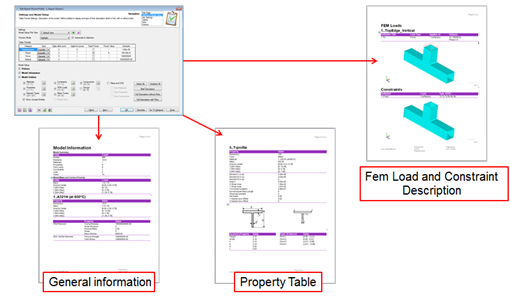
Figure 14: Model Setup Report
Figure 15 shows some of the sample results checks, tables, and plots that can be added using the report wizard.
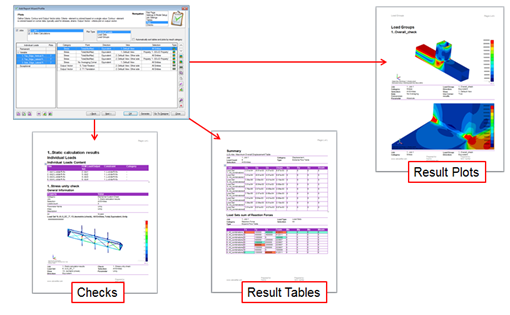
Figure 15: Results Report
Figure 16 shows some examples of the tables that can be created, including displacement on selected nodes, with the absolute maximums highlighted, the extreme values for elements in each property, the sum of applied forces for each load case, maximum stress values for each load case, and the maximum stress values for each direction.
Figure 17 shows two examples of the charts that can be created. The left side has a histogram of maximum results for each load case and load set. The right side shows a chart of node or element results versus load cases and load sets.
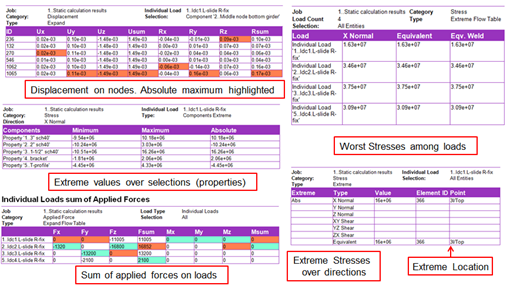
Figure 16: Results Tables
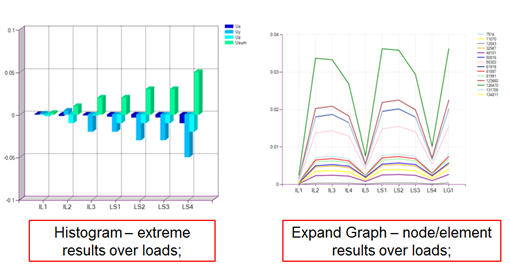
Figure 17: Histogram and Expand Graph charts
Figure 18 shows some of the sample results plots that can be created. You can define different views to show the same or different results, and each view can be used for as many different plots types as needed. The template is fully customizable by the end user.
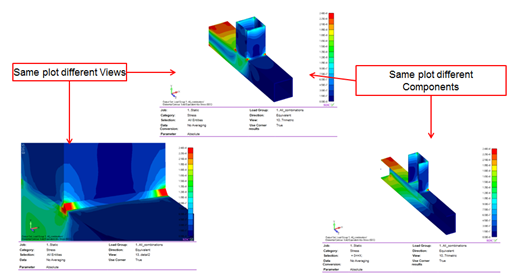
Figure 18: Results Plots
If you need to do more fine tuning of the reports, there is a Report Designer option that will allow full customization of each section of the report. You can drag and drop items into the report, change fonts and headings, add and remove any of the plot and table types that are available. A regenerate option exists in case you want to regenerate all or part of a report with updated information. Figure 19 shows the Report Designer.
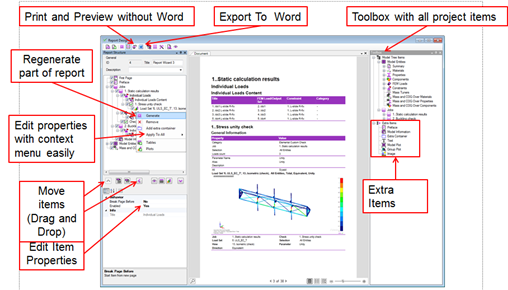
Figure 19: Report Generation with the Report Designer
Once the report template and standard or custom checks are defined, the file can be saved as a template and the template applied to an updated or a completely different model and a new report with new safety margins can be automatically produced. This new type of engineering workflow process seems very promising and potentially saves huge amounts of administration time, reduces the possibilities for human errors along the road and ensures that the analyst can focus on design issues and engineering solutions. Figure 20 shows a sample template run with one model, and then it was rerun with a different model to get a brand new report.
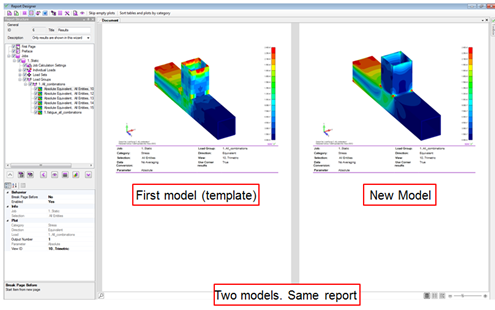
Figure 20: Report Template
Conclusion
This has been a short overview of the SDC Verifier tool that uses a unique process to automatically recognize features of the model that can be used in industry standard checks, such as beam and plate buckling, fatigue analysis, joint analysis, and also in custom equations that may be specific to individual customers. These results can then be automatically fed into the report wizard and report designer tools so that the user can automatically create new reports for each load case or load set, with the final margin of safety highlighted in the report. There are also tools available to help the user manage a combination of individual loads into load sets, and load sets into load groups for detailed analysis. Then the reports can be saved as a template, to make it very quick and easy to run new load cases, or modifications to the design to find the final margin of safety since the templates are not model specific, and can be rerun with any finite element model. This can free up the engineer to work on the optimizing the design, since less time will be spent on doing the calculation of individual margins and creating reports, and they will be able to quickly find out if any part of the model is failing due to any of the analysis check requirements. The time lost in the often repeated process of data manipulation can now be used to focus on improving the design. This will let the engineer be an analyst, not an admin.


