Example F.10 WT-Shape Flexural Member
This benchmark examines the flexural performance of an ASTM A992 WT-shape beam with a nominal depth of 5 inches, modeled in FEMAP and verified with SDC Verifier 2024 R2.
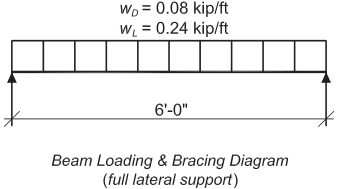
The structural member, spanning 6 feet with continuous bracing, is subjected to uniform dead and live loads. Flexural strength calculations follow AISC provisions, with adjustments for modeling simplifications noted.
The analysis involves cross-verification of material properties and geometric characteristics, highlighting the Mapped Property function’s role in refining moment of inertia values. Additionally, SDC Verifier’s automatic slenderness calculations ensure correct application of stability criteria.
Task
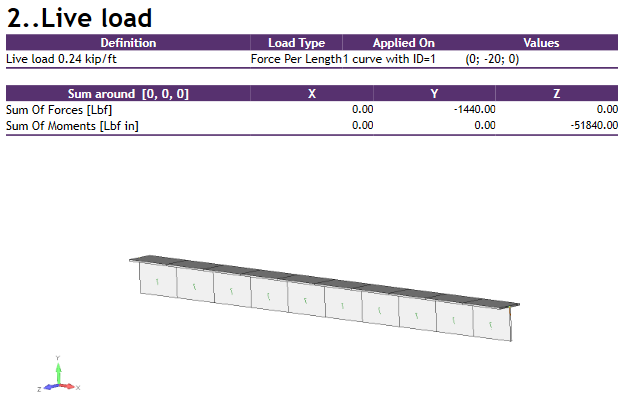
Select an ASTM A992 WT beam with a 5-in. nominal depth and a simple span of 6 ft. The toe of the stem of the WT is in tension. The loads are a uniform dead load of 0.08 kip/ft and a uniform live load of 0.24 kip/ft. There is no deflection limit for this member. The beam is continuously braced.
Solution
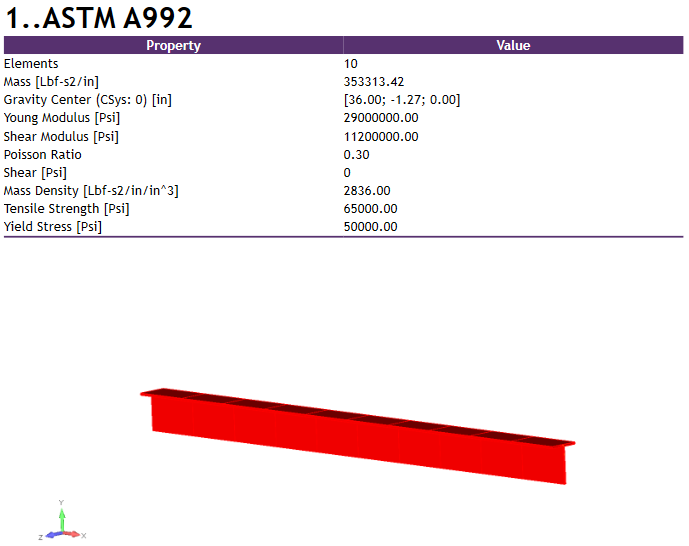
From AISC Manual Table 2-4, the material properties are as follows:
- ASTM A992ASTM A992
- Fy = 50 ksi
- FU = 65 ksi
From Chapter 2 of ASCE/SEI 7, the required flexural strength is:

Try a WT5x6.
From AISC Manual Table 1-8, the geometric properties are as follows:
- WT5x6
- d=4.94 in.
- Ix=4.35 in.4
- Zx=2.20 in.3
- Sx=1.22 in.3
- bf=3.96 in.
- tf=0.210 in.
- y−=1.36 in.
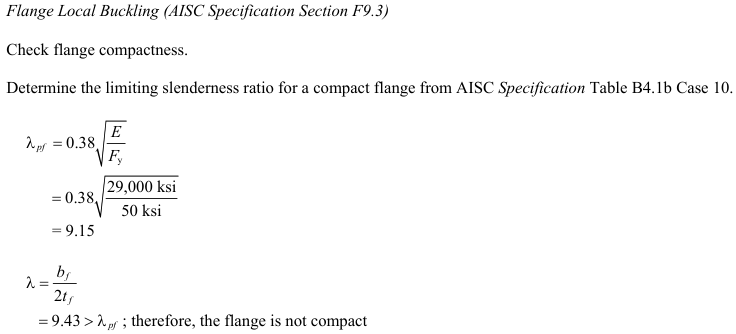
- bf/2tf=9.43
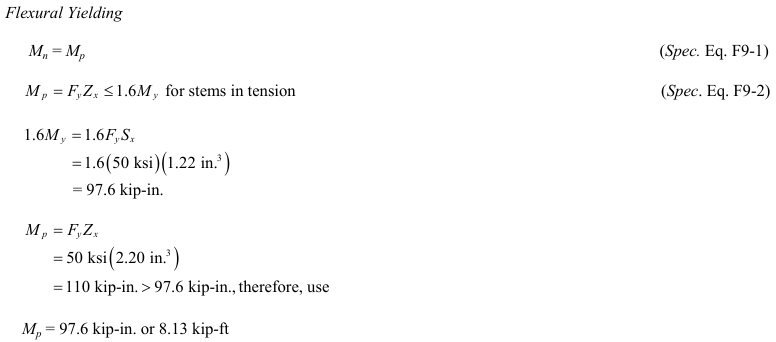

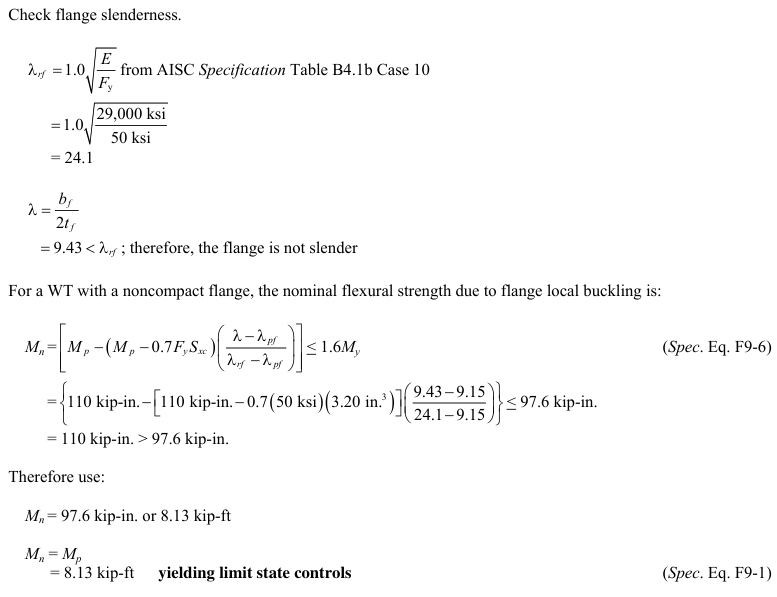
From AISC Specification Section F1, the available flexural strength is:

Example from AISC Design Examples
Material Summary
Properties Summary
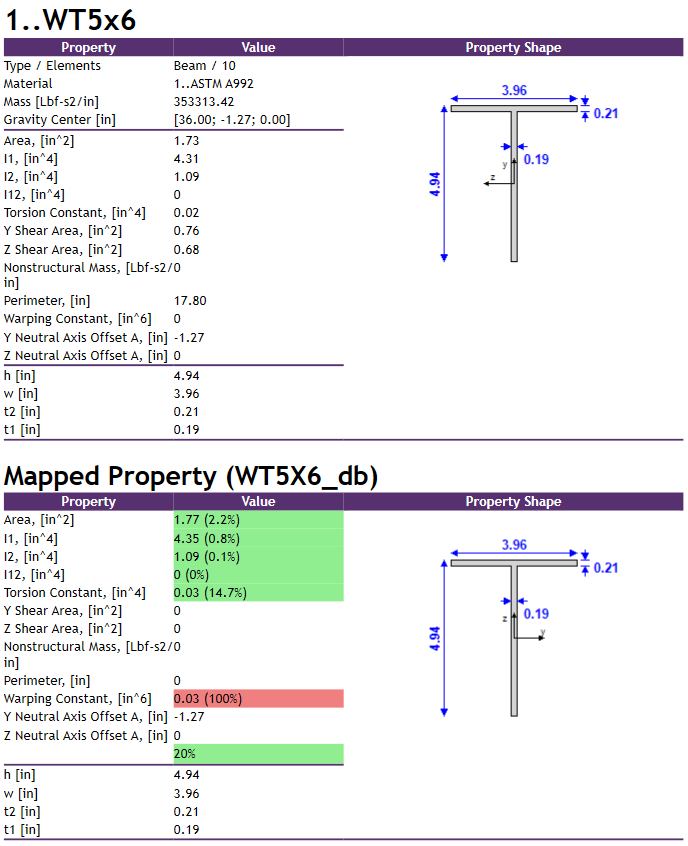
As we can see the WT5x6 property created in Femap has slightly inaccurate values of area and inertia moments due to the fact that it’s modelled with a simplified approach without fillets. That’s why we use the Mapped Property function in SDC which allows to adjust these values – for example we can see that the Ix (I1) value changes from 4.31 in^4 to 4.35 in^4, which perfectly matches the geometrical properties given in the example.
FEM Loads and Constraints

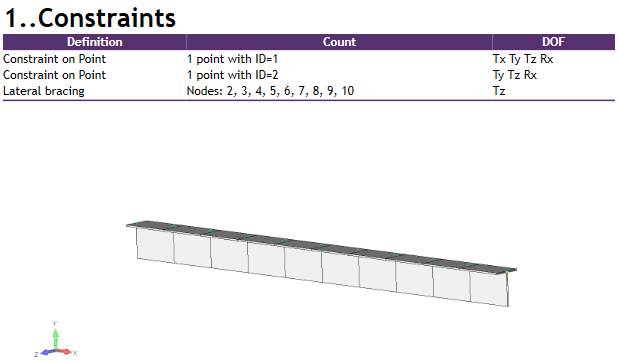
Results


 |
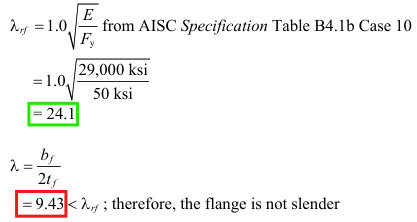 |
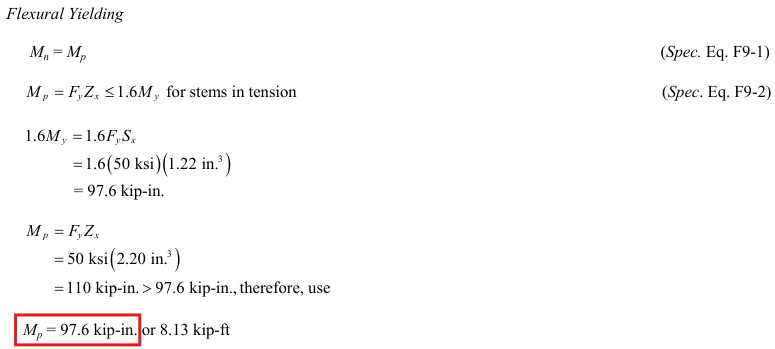
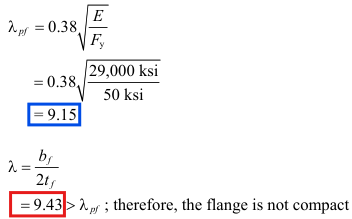
SDC Verifier calculates the λpf and λrf limits and makes the correct equation choices based on the resultant slenderness type automatically, but their values can be checked in the calculation details.


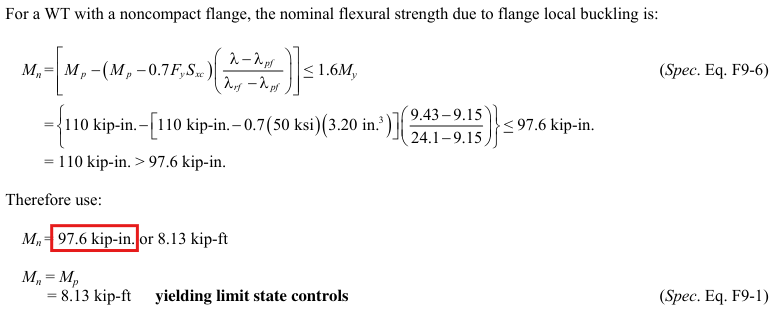
The slight difference comes from the mistake in the example where the value of Mp used in Eq. (F9-6) above is 110 kip-in. while previously calculated and chosen is 97.6 kip-in. In SDC the value is correctly taken as 97.6 kip-in., hence the result for flange local buckling is lower and controls.


The available flexural strength from SDC results is:
96947 Lbf in * 0.90 = Lbf in = 7.27 kip ft
Comparing results of calculation in SDC Verifier and in Example F.10 we can see that values completely match.
Conclusion
The analysis confirms that the SDC Verifier results align closely with the values presented in Example F.10. Minor discrepancies, such as adjustments in moment of inertia due to simplified modeling in FEMAP, are effectively mitigated by SDC Verifier’s Mapped Property function. The automated selection of slenderness limits in SDC Verifier ensures reliable assessment of local flange buckling strength.
Ultimately, this case study validates SDC Verifier’s accuracy in flexural strength calculations for WT-shape members, demonstrating consistency and precision in structural analysis workflows.


