Report Designer
Report Designer automates the process of creating a report. The Report Designer offers additional possibilities comparing to Report Wizard:
- Generate single item in the report and modify it if necessary;
- Complete control over report structure;
- Add custom chapters, comments, images;
- Import content from other Word Document;
To Add Report Wizard execute from the tree:
Report Wizard can be converted to Report Designer using the context menu.
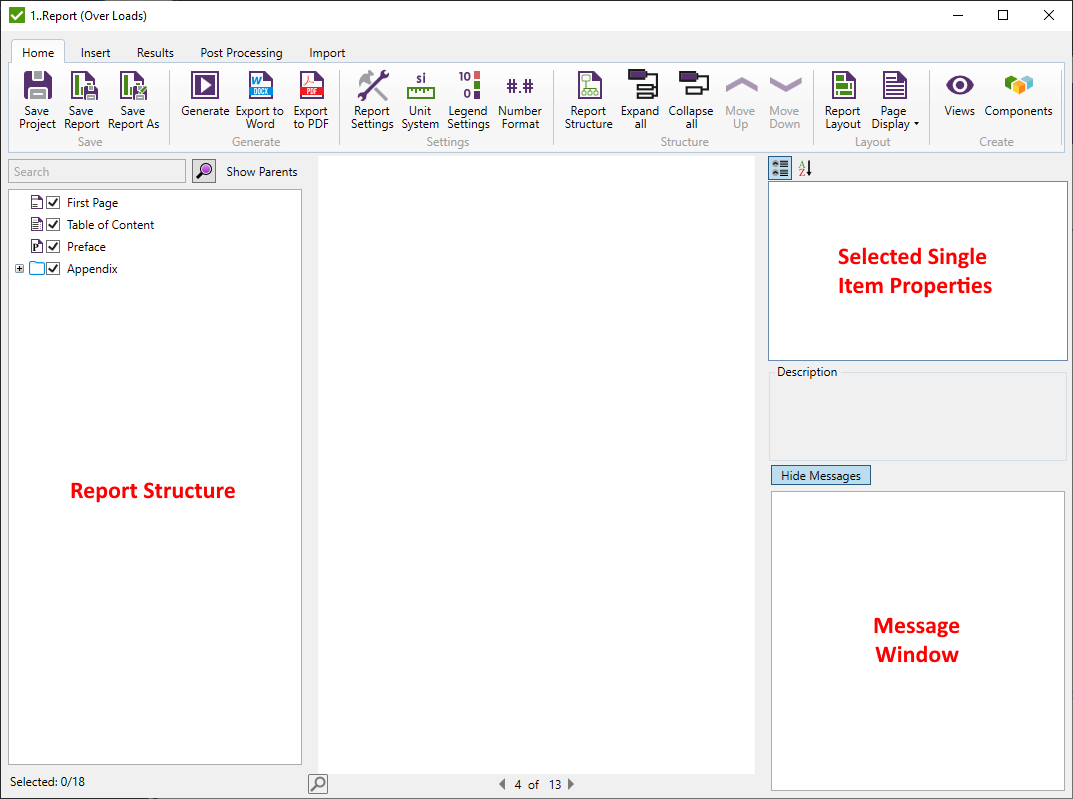
Home
 - save the current Report together with a Project file without a necessity to close the designer window;
 - save (Ctrl+S) the Report;
 - copy the Report;
 - generate full Report (CTR + ALT + G);
 - export generated items to Microsoft Word and start it automatically;
 - export generated items to PDF and opens the document automatically;
 -
-  - Unit System;
 -
-  -
-  - define how results are added into the report (over loads or selections) in Report Structure;
 - expand all items in the structure;
 - collapse all items in the structure;
 - move selected items up;
 - move selected items down;
 - Report Layout settings: first page layout, header and footer, margin and font settings;
 - page display mode: One Page, Two Pages or Scroll (full report as single continuous page);
 - manage Views in the project;
 - manage Components in the project;
Insert
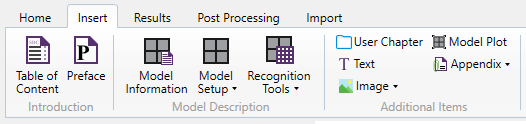
 - a table of content (added after export to Word);
 - a description of CAE program and SDC Verifier version that is used to generate a report;
 - a summary table with the model entities amount, mass, center of gravity and Min/Max coordinate for certain directions X, Y and Z;
 - a detailed description of the model entities (materials, properties, components, femloads, constraints and coefficients);
 - a description of recognized items (beam members, welds and sections);
 - user defined chapter;
 - custom text (title is optional);
 - image from file or clipboard;
 - insert model plot (based on user selection);
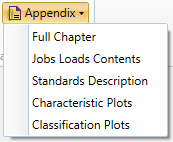
 - open menu to include the following appendix items:
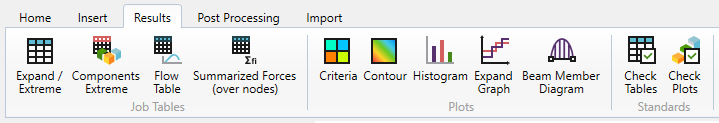
Results
Plots and Tables are created the same as in the Report Wizard with the only difference - loads have to be selected. In report designer the results are automatically sorted based on options from Report Structure.
 -
-  -
-  - Flow Table;
 - Summarized Forces (over nodes);
 -
-  - Contour Plot;
 - Histogram;
 - Expand Graph;
 - Beam Member Diagram Plot;
 - Standard Tables (Expand/Extreme, Components Table, Flow Table);
 - Standard Plots (Criteria and Contour);
Post Processing
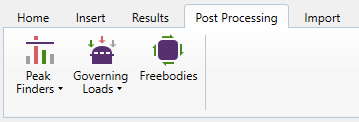
 - import or create Peak Finder Tables;
 - import or create Governing Loads;
 - import Freebodies from the project;
Import
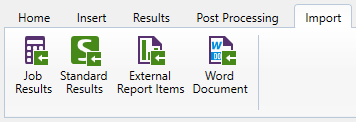
 - import job tables/plots from the project;
 - import standards tables/plots from the project;
 - import items from other report designers;
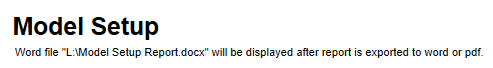
 - define the path of an existing Word document that will be inserted in the report after exporting it to Word or PDF:
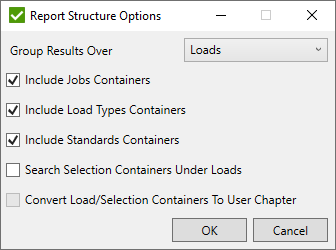
Report Structure
Report Structure defines how result items (tables, plots, post-processing results) are added into the report:
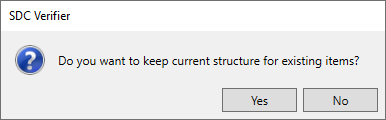
Note: when changing report structure from Loads to Selections or vice versa, message will be shown if to keep current report structure or automatically change structure according to selected:
Results can be grouped over Loads or Selections:
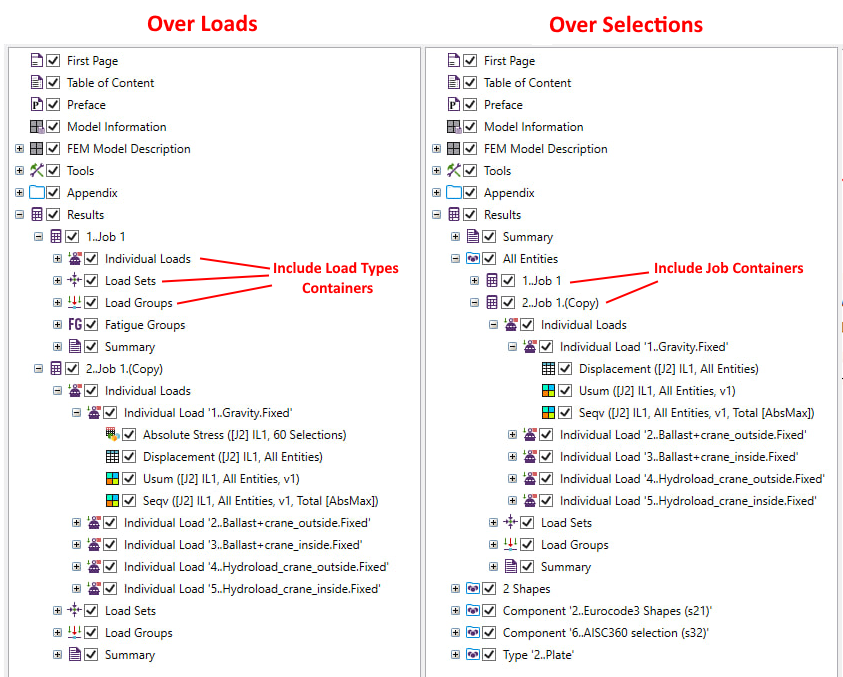
When Table/Plot is edited and load/selection is changed, the item is moved under correspondent Load/Selection automatically. Moreover, when the item is dropped under Load/Selection its load/selection is updated as well.
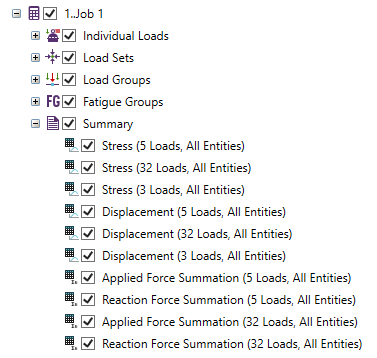
Tables/Plots with multiple loads of the same Job are placed under Job Summary Chapter (for loads from different Jobs in Summary under Results chapter):
Convert Load/Selection Containers To User Chapter - When copy result item under load/selection container, load/selection inside the item will be changed. If converted to user chapter - load/selection will stay the same when moving result items under user chapter.
Property Grid
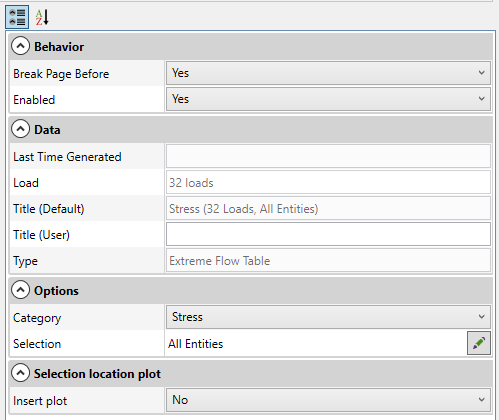
Property Grid - display/modify the properties of the selected item:
Context Menu
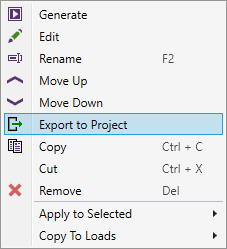
All commands except Add and Select Items in the context menu are applied to selected items.
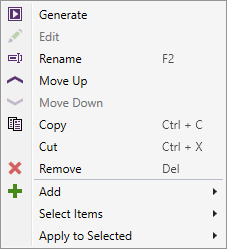
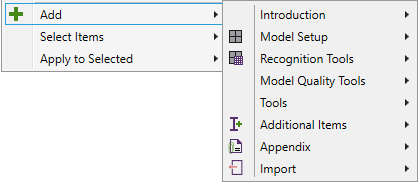
Add - add report items (similar functionality to the main menu except for results) into the selected item.
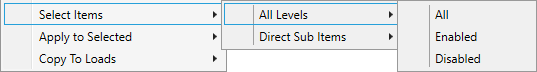
Select Items - select sub-items (All Levels or Direct Sub Items) with the following options - All, Enabled, Disabled.
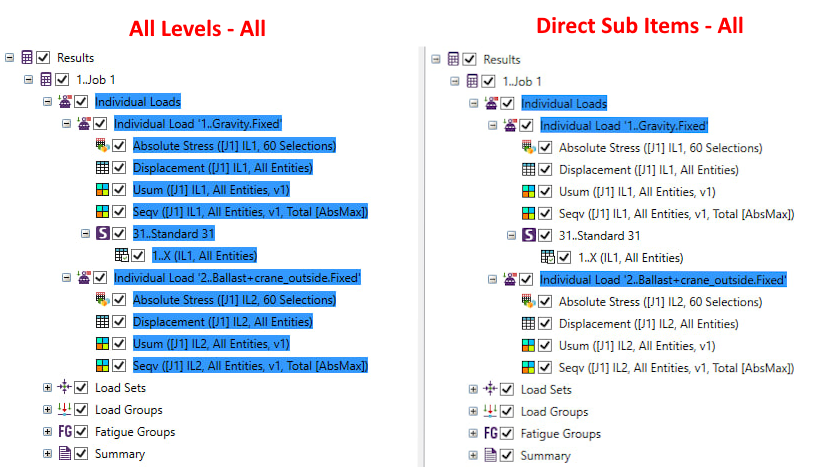
Select Items - All Levels / Direct Sub Items - All example on Individual Loads:
Apply to Selected - quickly modify existing items. The list of commands depends on the selected items.
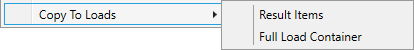
Copy To Loads - commands to quickly copy result items for multiple loads.
- Result Items - create a copy of results items only for selected loads;
- Full Load Container - create a copy of Load Container with all sub-items for selected loads (available only when single Load Container is selected);
Export to Project
It is possible to export result tables/plots, peak finder tables or governing loads from the report to the project.
Note: Command is available only if all selected items can be exported to the project.
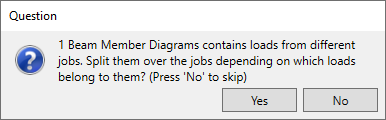
Note: If selected Beam Member Diagram Plots will use loads from different jobs - notification will be displayed if to split them for multiple jobs by using only the loads of respective job or to skip them:
Note: Peak Finder Tables will be grouped by the same settings (Category, Standard etc.). New Peak Finder will be created in the project if any existing Peak Finder has the same settings.
Apply To Selected
The following commands are available for any selected items:
- Break Page Before - start the selected items from a new page;
- Enable/Disable - include or exclude items. If parent item is excluded its children are excluded as well;
- Restore Default Title - all user-defined titles will be set to blank and default titles will be used.
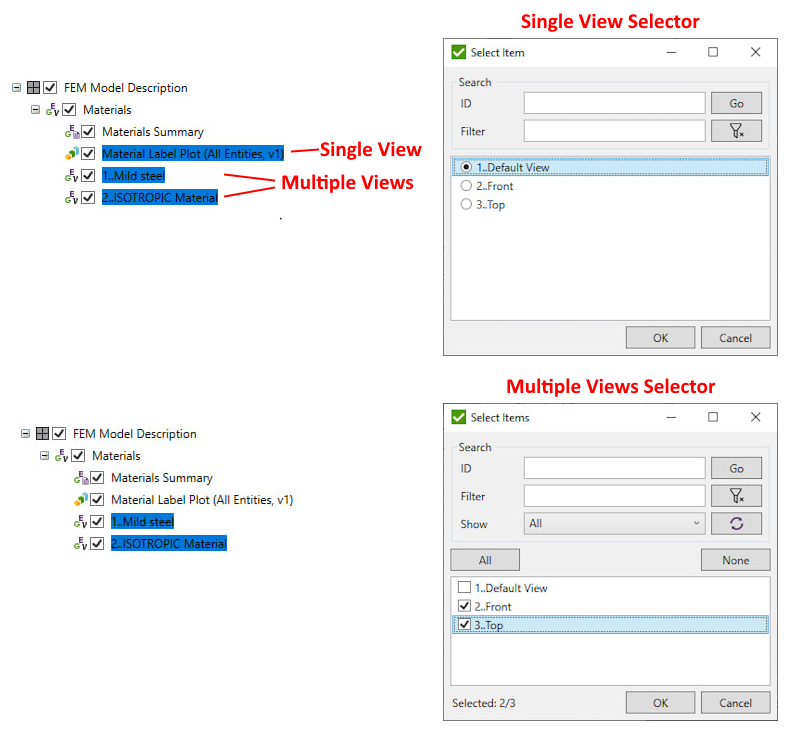
View(s)/Selection(s)/Load(s) commands:
- Views(s) - change single view or multiple views (model setup items);
- Selection(s) - change single selection or multiple selections (components extreme tables) in plots/tables;
- Load(s) - change single load or multiple loads (flow tables) in plots/tables.
If selected items contain at least one item that uses only one view/selection/load the single view/selection/load selection dialog will be displayed. Items with multiple views/selections/loads are updated after a ingle selection as well.
Commands for Model Setup Items:
- Preview Mode - highlight (color the selected part of the model, the rest of the model is transparent) or Display Only Selected (shows only selected part of the model);
- Include Selection Min/Max Coordinates - min/max coordinates for Materials, Properties and Components;
- Show FEM Load Value (on plot) - display load magnitude;
- Show Constraint DOF (on plot) - display degree of freedom.
Commands for Load Container Items:
- Include Load Item Content - detailed description for each load (items, factors, results);
- Include Individual Load Plot - include plot with boundary conditions;
- Include Sum of Forces - table for each load with the sum of forces.
Peak Finders
Loads should be selected using the Multiple Loads Selector.
Selections should be defined using Selection List.
Views should be selected from the View List.
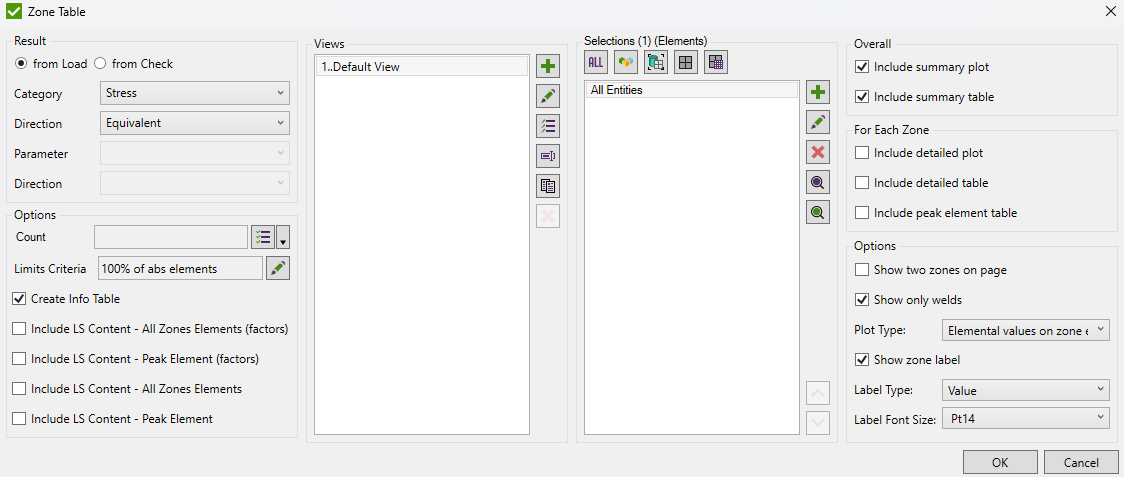
In the Overall group box, it is possible to control whether the summary plot/table will be included into the report. The Overall - all zones are shown on 1 plot/ in 1 table:
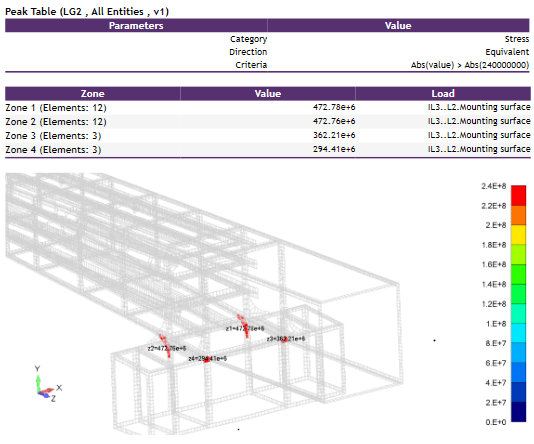
In the For each zone group box, define if the detailed plot/table should be included for each zone separately. Also, it is possible to include a table on load group items for the peak element. The results for all elements in the zone and the peak element over the load group items are shown in the tables:
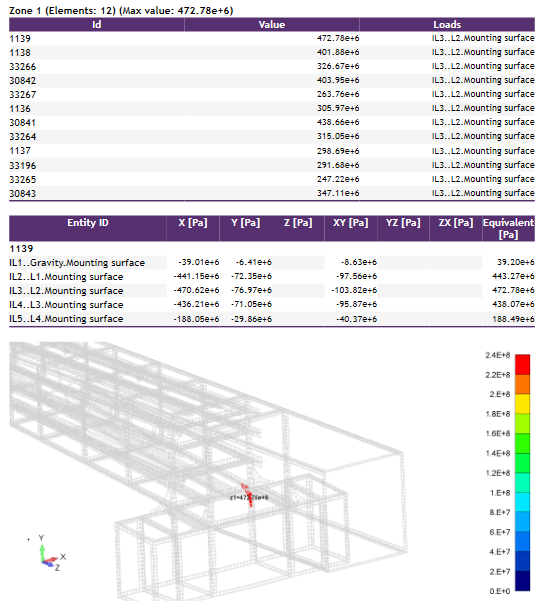
Note: For Individual loads and Load sets, the peak element table is skipped.
By default, each zone starts from a new page, but it is possible to show 2 zones per page using the option - Show Two Zone on Page.
By using the Show Only Welds Option, the plot displays only the peak and the welds elements. See the examples above.
Plot Type defines what values should be plotted on the model (elemental or single value on all zone elements).
It is possible to show the label for each zone of the following types: Id, Value or Id and Value. The Id is the default value.
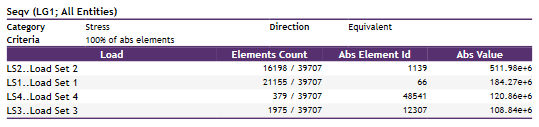
Governing Loads
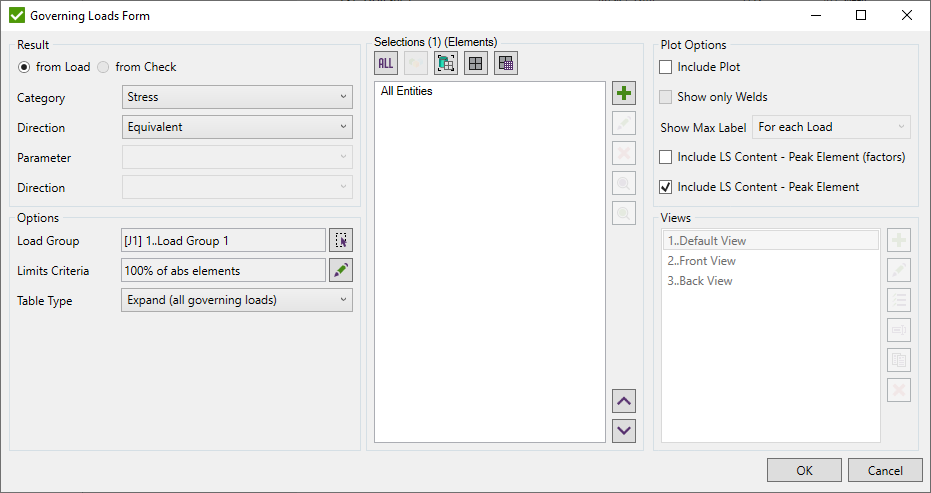
Options are described in Governing Load Tool chapter.
The table with data and settings description will be generated.
Model Quality
Model Quality is the set of tools to check the model on errors.
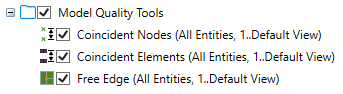
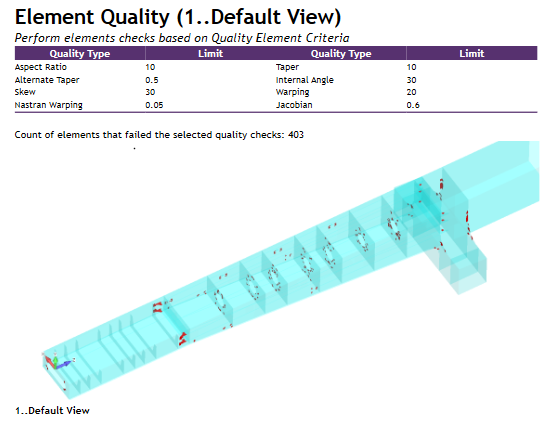
Element quality - performs elements checks based on the Quality Element Criteria.
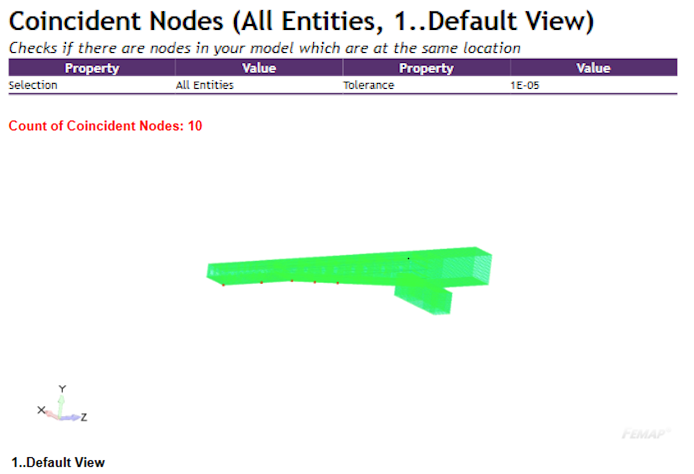
Coincident Nodes - checks if there are nodes which are at the same location in the model.
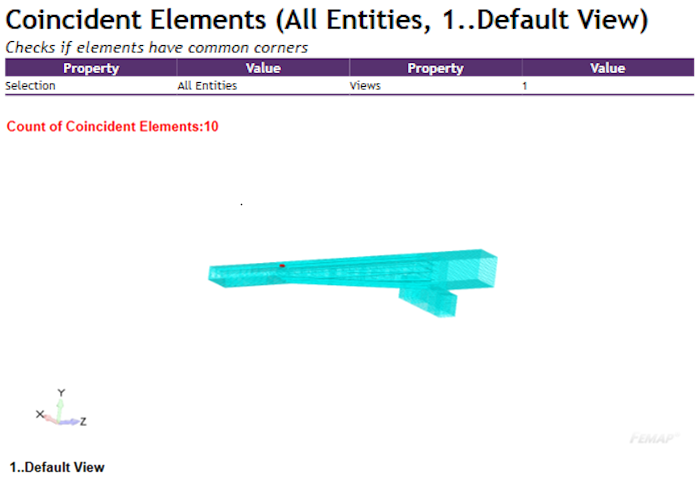
Coincident Elements - checks if there are elements with common (3 or more) corners in the model.
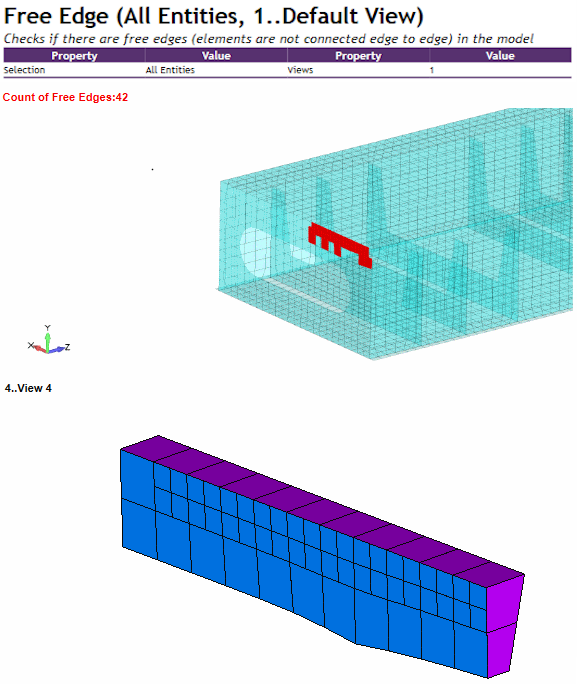
Free Edge - checks if there are free edges (the elements are not connected edge to edge) in the model.
It is possible to select a few views for all tools.
Characteristic Plots
To add characteristic plots execute Add - Appendix - Characteristic Plots from the context menu:
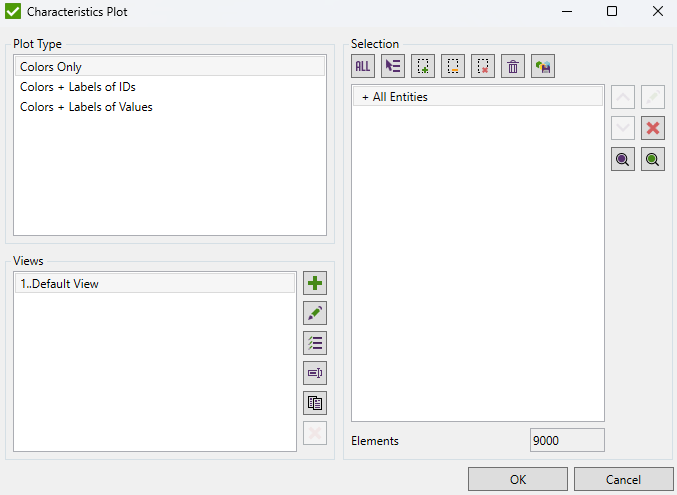
Select Plot Type, Views and Selections to create plots. The amount of plots is a combination of all selected parameters.
Classification Plots
To add classification plots execute Add - Appendix - Classification Plots from the context menu:
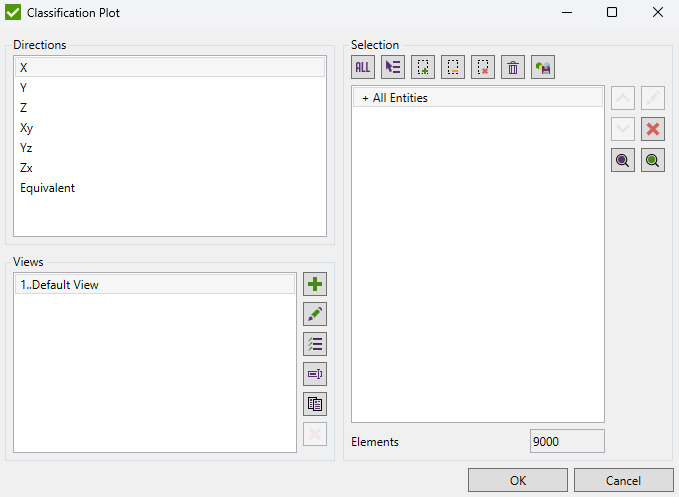
Select Directions, Views and Selections to create the plots. An amount of plots is the combination of all selected parameters.
Report Layout
Report Layout- allows customizing an appearance of the generated content. It contains the following sections:
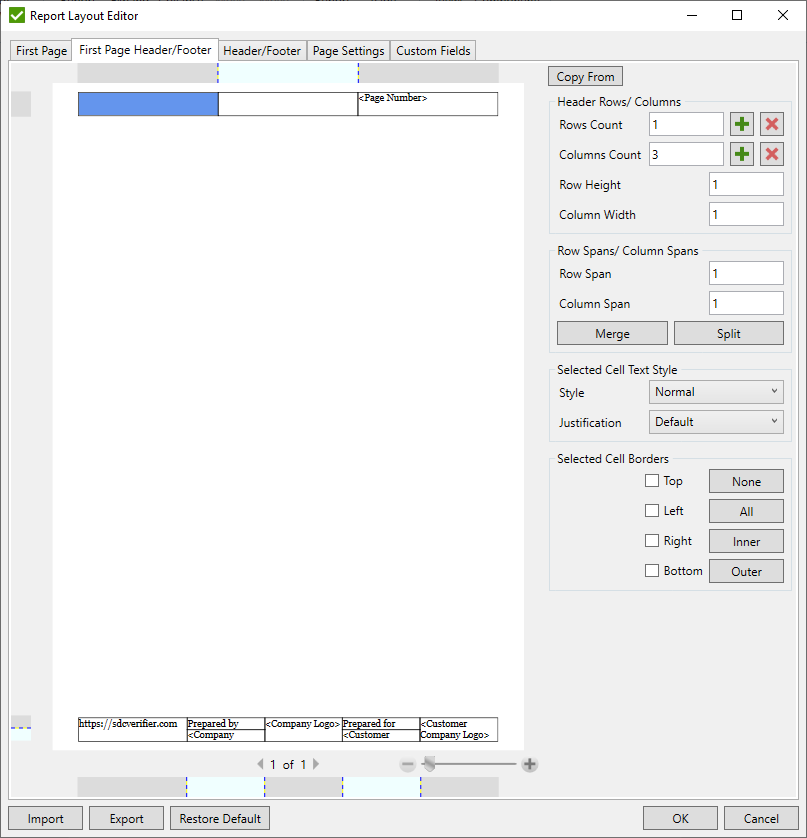
First page layout:
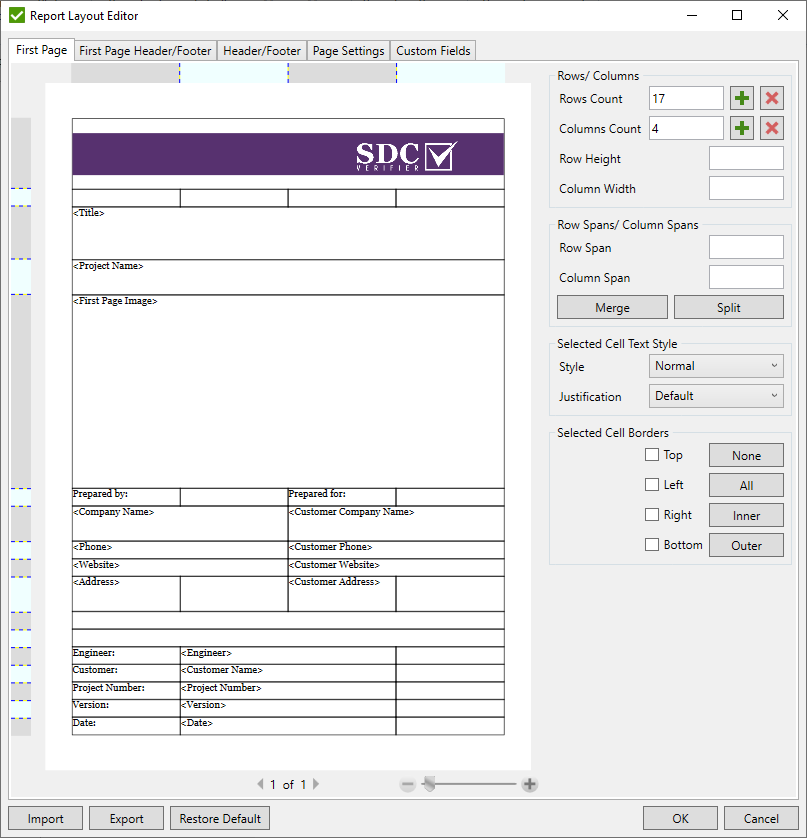
The layout is based on the table grid. Each row and column has its own scale factor. This factor determines the portion from the page content height and width that will be calculated for each cell.
Height and width of each cell depending on the page size (A4 or Letter) and margins. The row and column total factor is based on the sum of all rows and columns scale factors.
Row total scale factor = row scale factor (e.g. 1) / sum of all rows scale factors (e.g. 20) = 1/20;
Column total scale factor = column scale factor (e.g. 2) / sum of all columns scale factors (e.g. 15) = 2/15;
Cell Height = (Page Height - Margin Top - Margin Bottom) * Row total scale factor;
Cell Width = (Page Width - Margin Left - Margin Right) * Column total scale factor;
It is possible to customize each cell of the table by setting the type of displayed information. Right click on the respective cell will open a context menu with possible options:
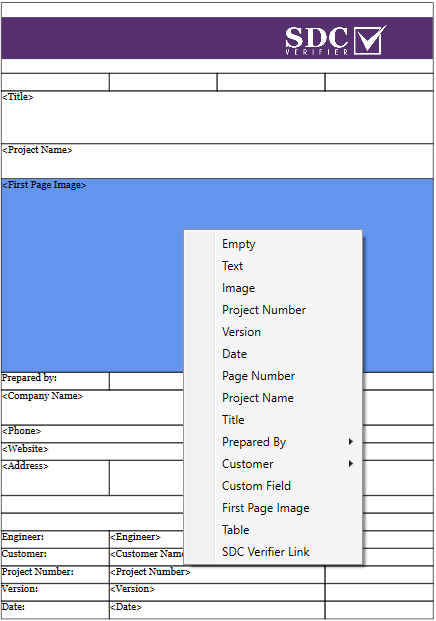
- Empty - blank cell;
- Text - manually defined text;
- Image - constant image selected from a file (.png, .bmp, .jpeg etc.);
- Project number, Version, Project Name, Prepared By and Customer values are taken dynamically from each report First Page Settings;
- Date - current system date;
- Page number - a number of the current page;
- Custom Field - a value of the selected field. Custom field values are stored in the project file and can be different from project to project. Field names and descriptions are stored in settings and can be used between the projects;
- First Page Image - a picture is taken from the view or from the file in the First Page Settings.
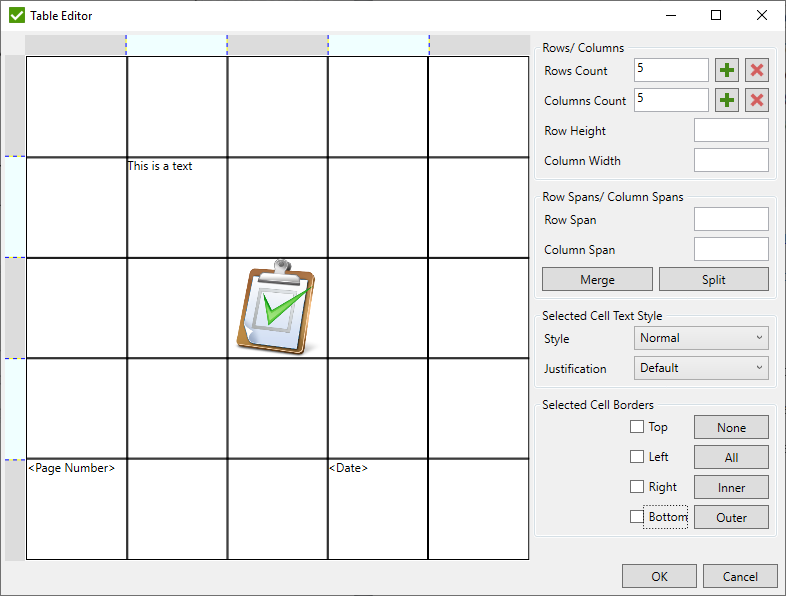
- Table - open window to insert a new table into the selected cell without modifying the height/width of the cell.
Note: Each cell can be customized using the context menu as described above.
Note:All the settings are applied immediately to the selected cells.
Rows and Columns:
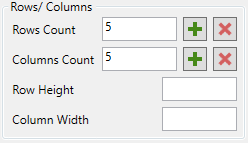
Rows and Columns Count defines table grid dimensions. Row Height/Width defines the proportion of the cell size comparing to other rows.
Note: If rows or columns count in the current grid is bigger than defined, rows and columns that do not fit the dimensions will be removed.
Add or remove selected Row/Column by pressing  and
and  buttons.
Row Spans / Column Spans:
Row/Column spans define how many cells will be merged horizontally (right) / vertically (down) from the current cell.
- merge selected cells;
- split cells;
Style - Text style defined in Fonts/Margins section.
Justification - defines the position of the text (center, left, right). The default value will take justification from the applied style;
Selected Cell Borders:

All/None buttons apply full or empty borders;
Inner - apply borders on the sides where the cell has no adjacent selected cells;
Outer - apply borders on sides where the cell has adjacent selected cells;
First Page Header/First Page Footer/Header/Footer:
Headers and footers are located at the top and bottom parts of the page. They will be displayed after a report is exported to Word or PDF.
Header/Footer layout is based on the table grid as well as the First Page Layout section.
Note: Header and footer are represented by separate tables. To apply the values, select the header or the footer table.
Page Settings
Page settings section allows to modify a standard text style settings and customizes own styles, modify table borders and colors, set page size and margins.
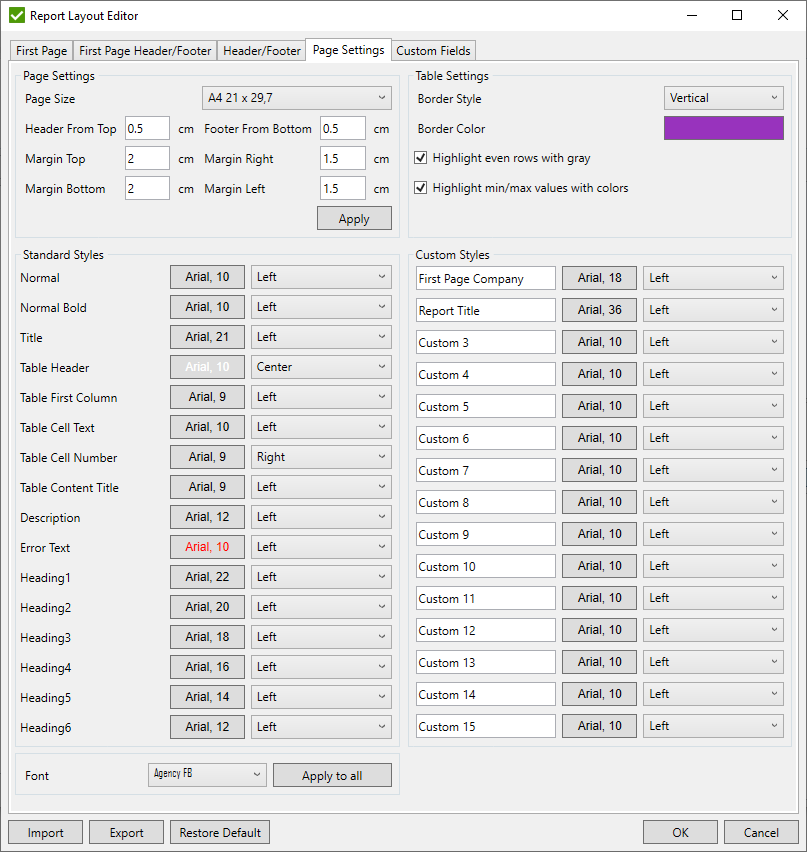
Table Settings:
Table settings are used in all result tables, model entities info tables and standard's items (classifications, checks, etc.)
Border Style - Default borders (defined by SDC Verifier) or full border (the border between all rows and borders).
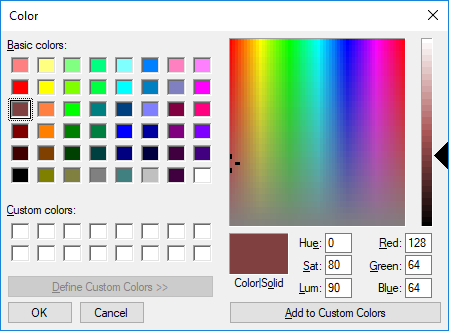
Border Color - a color of all borders and table headers in all descriptions, info and result tables.
Press on current color to open color picker:
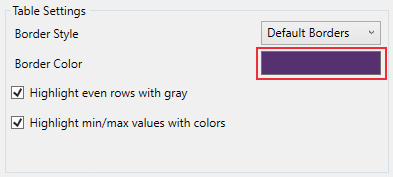
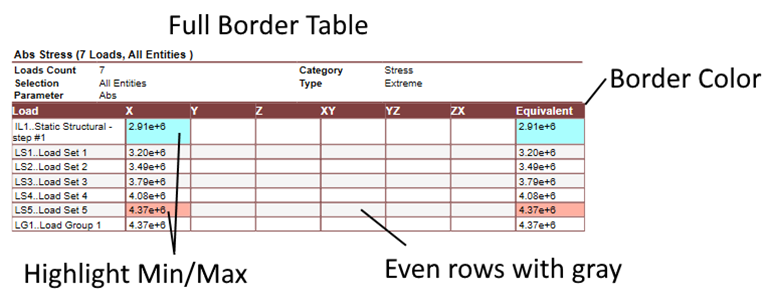
Highlight even rows with gray - each second row of the table will be filled with gray background color;
Highlight min/max values with colors - available only for result tables created for jobs. Min/max values will be highlighted among each column of the table.
Note: Min/Max colors will be displayed instead of gray if the option is turned ON.
Example of the table:
Page Settings:
Page settings define the size of the generated content.Page size - A4 (21 x 29.7 cm) or Letter (21.59 x 29.74 cm).
Header from Top - decrease the size of the header by setting an additional margin from the top of the page. Header size = - Header from Top.
Footer from Bottom - decrease the size of the footer by setting an additional margin from the bottom of the page. Footer size = - Footer from Bottom.
Margins defined direction (top, bottom, left or right). The minimum size of all margins is 0.5 cm.
Note: The maximum size of all margins is 9. The minimum size for the bottom margin is footer height + 0.5cm. The minimum size for the top margin is header height + 0.5cm.
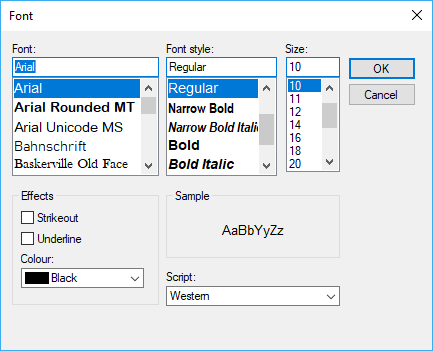
Styles:
The style contains a name, font settings and justification. Standard styles are used by default. Custom styles can be applied to the first page and header/footer settings.

Select justification (left, right or center) from the drop-down list. Value is used as default.
Note: In the first page and header/footer settings this value is used only when the Default justification is applied to the blocks that use current style.
To change the font press on the font name (e.g. Arial, 10) button:
Custom Fields:
Custom fields are user-defined text and can be used in the first page or header/footer settings.
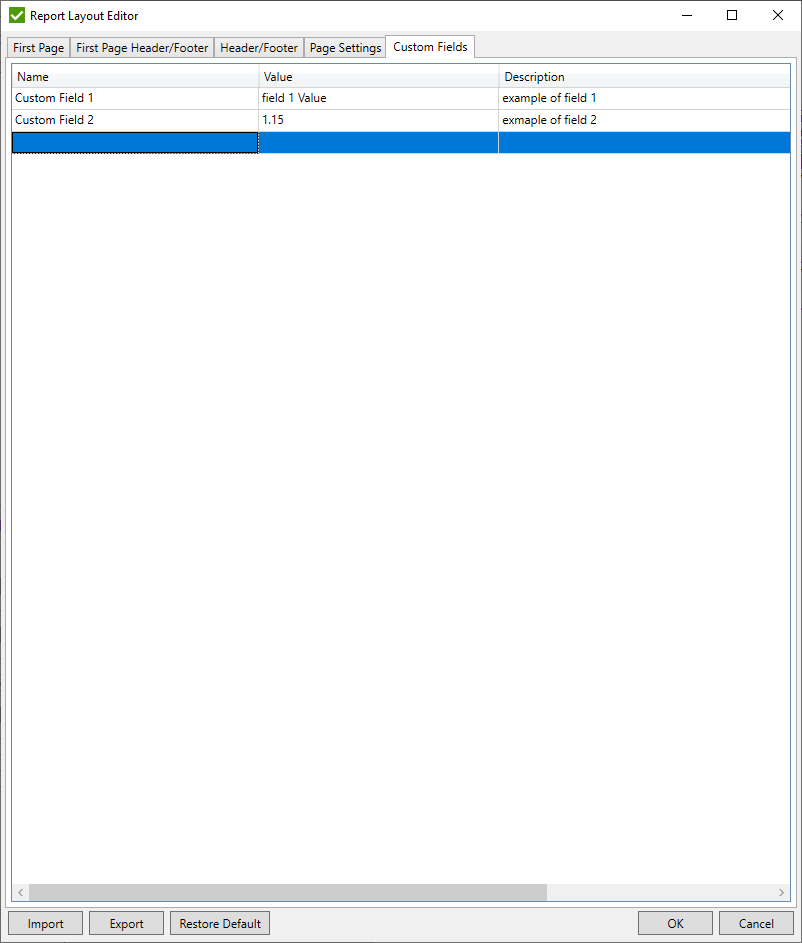
Names and descriptions of the custom fields are stored in the settings. They can be used between the projects.
Values that will be displayed are stored to the project and are common for all reports. For each new project, values have to be defined manually.
It is possible to full layout to the file and from a file. Different layouts may be used for a different project. will reset all settings to default for the full layout.
Note: Change of a report layout in one project will lead to changing layout in others.