Report Wizard
Report Wizard – gives a possibility to build a report using step by step wizard. It is possible to generate a word report from the wizard or to continue with the report in the designer.
To Add Report Wizard execute from the tree:

 - define Report Settings;
 - open a window to define a Unit System;
 - open a window to define a Legend Settings;
 - open a window to define Number Formats;
 - manage Components in the project;
 - manage Views in the project;
- generate a report and export to Microsoft Word;
- convert Report Wizard into Report Designer.
First Page
First Page - information that will be displayed on the first page of the report:
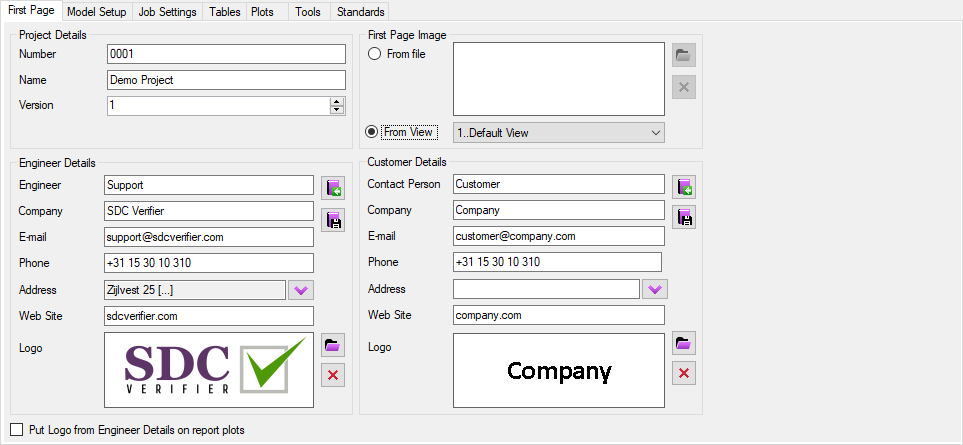
Project Details – a project number, report version and a project name;
First Page Image – an image file or plot of a model with the selected view;
Engineer details – a company and an engineer details that prepared this report;
Customer details – a company for whom the report is prepared;
 - store an Engineer/Customer information to the library;
 - load an Engineer/Customer information from the library;
 - browse logo;
 - clear logo.
Model Setup
Model Setup - model description to include in the report:
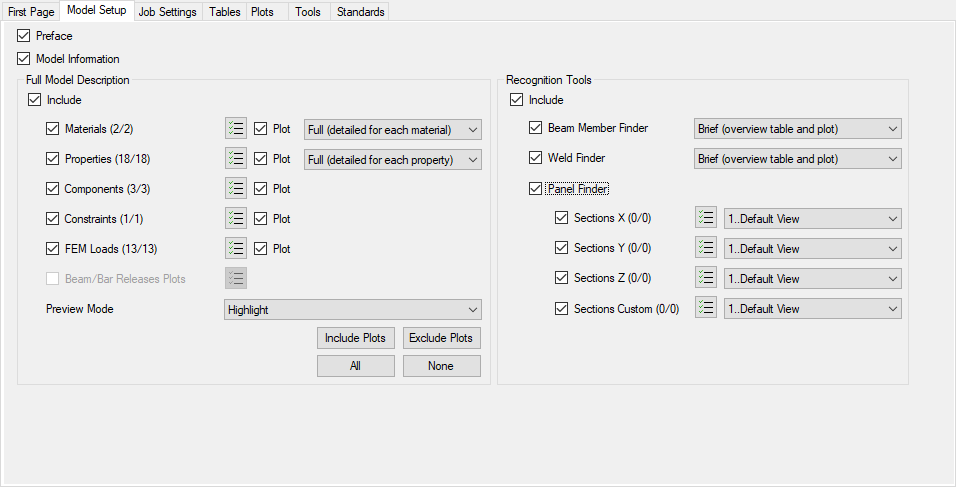
Preface – a description of CAE program and SDC Verifier version that is used to generate a report;
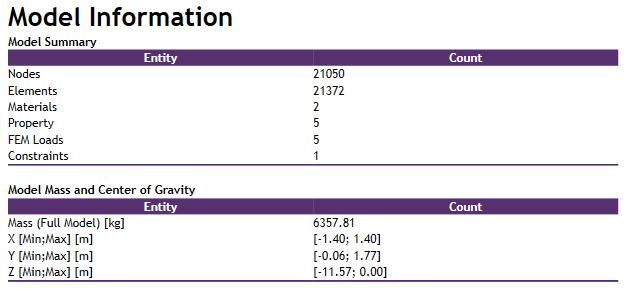
Model Information – a summary table with the model entities amount, mass, center of gravity and Min/Max coordinate for certain directions X, Y and Z:
Full Model Description – the detailed description of the model entities. For materials and properties define the type of description Brief or Full.
It is possible to include preview plots for model entities (for materials/plots available only with the Full option).
Recognition Tools – the description of recognized items (beam members, welds and sections). Full - description for each beam member/weld/section will be include, Brief - only summary.
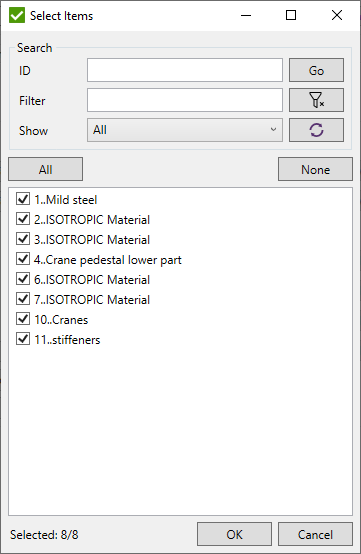
Press  to select what entities should be included in the report:
Preview Mode - preview method of the model entities plots. Highlight - highlight related entity items in the entire model.Preview only selected - preview only related entity items;
Job Settings
Job Settings - load display options, load contents and predefined tables:
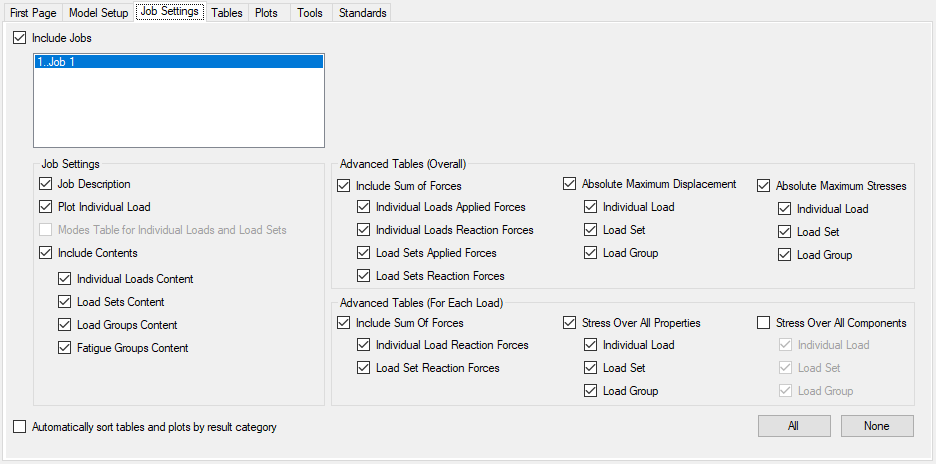
Settings are configured per Job, only Automatically sort tables and plots by result category is shared among all the jobs.
Job Description - include a table with the following information: type of analysis, selection and tables with requested results.
Plot Individual Load - insert plot with forces and constraints for each included (any plot or table is included) Individual Load.
Modes Table for ILs and LSs - table with Eigenvalues from Load Results. It is used for buckling analysis to display the buckling factors.
Include Contents - include contents for Individual Loads, Load Sets, Load Groups and Fatigue Groups.
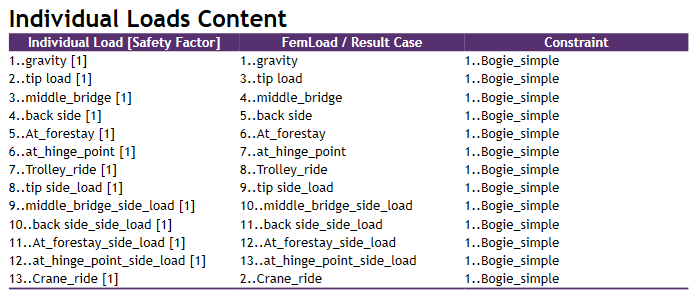
Individual Loads content:
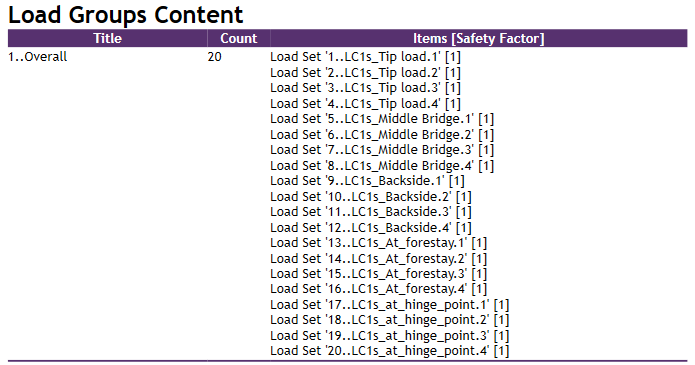
Load Groups content:
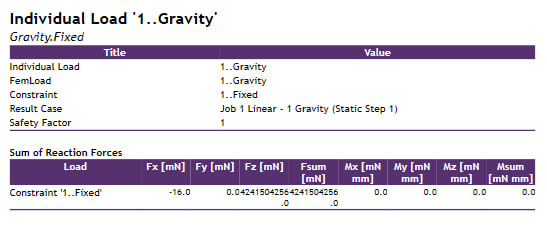
Include Sum of Forces (Overall) - include a summary table for all Individual Loads/Load Sets with Applied or Reaction Forces.
Include Sum of Forces (Each Load) - include a table for each Individual Load/ Load Set with a sum of reaction forces.
Absolute Maximum Displacement - include Extreme Flow Table of absolute maximum Displacement results overall directions for all Individual Loads, Load Sets, Load Groups.
Absolute Maximum Stresses - include Extreme Flow Table of absolute maximum Stress results overall directions for all Individual Loads, Load Sets, Load Groups.
Stress Over All Properties - include Component Extreme Table of absolute maximum stress results over each property for each Individual Load, Load Set, Load Group.
Stress Over All Components - include Component Extreme Table of absolute maximum stress results over each component for each Individual Load, Load Set, Load Group.
Tables
Tables - create or import existing tables from Job:
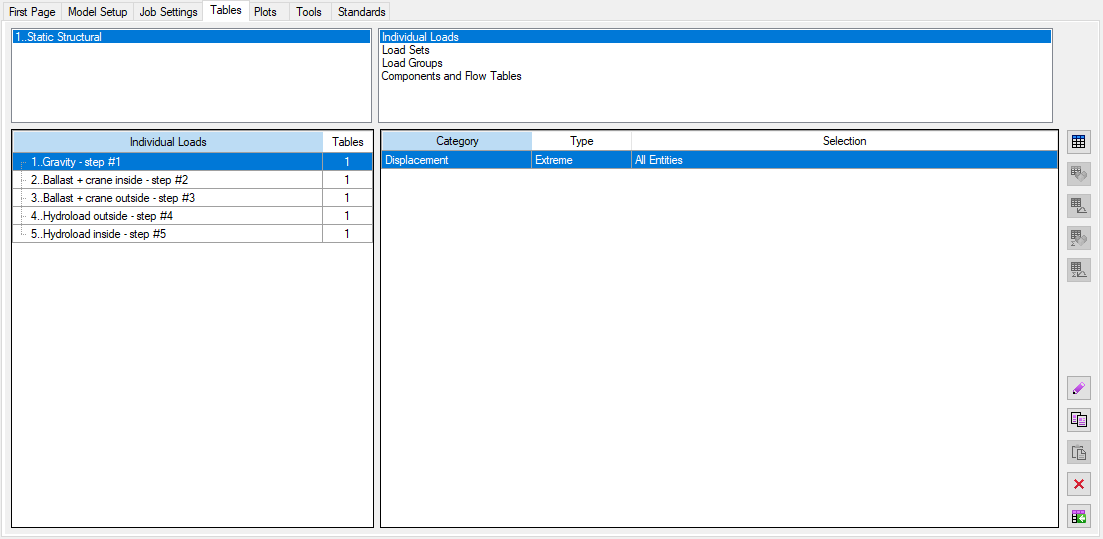
Select the Job and the Load Type, the table will be filled with correspondent loads. Common tables are shown for the selected loads.
Press to remove all the selected tables for all the selected loads.
Few tables can be modified at once using the context menu on top of correspondent columns.
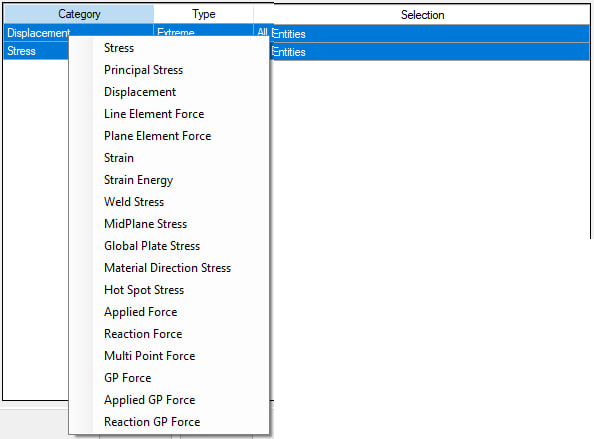
Edit Category
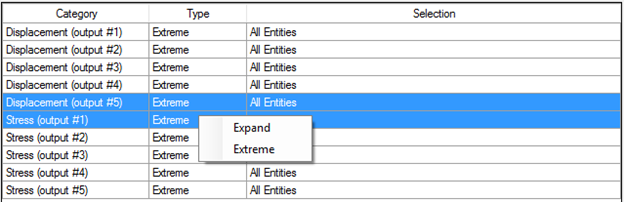
Edit Table Type
Edit Selection
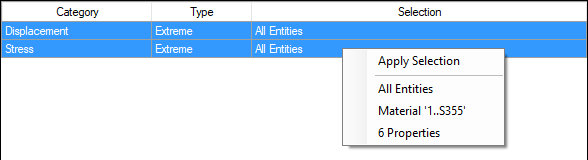
Press to apply a new selection or select recent from the list.
 - edit a single table.
 - import already existing tables from the selected Job (tables from selected Job and selected Load Type will be displayed).
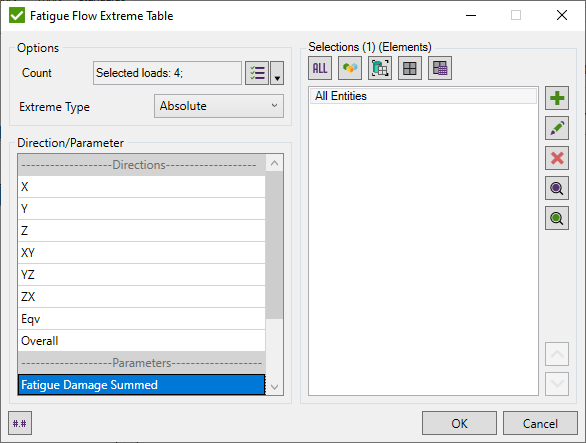
Add Expand/Extreme tables
Select the Loads and press  to add Expand/Extreme Tables.
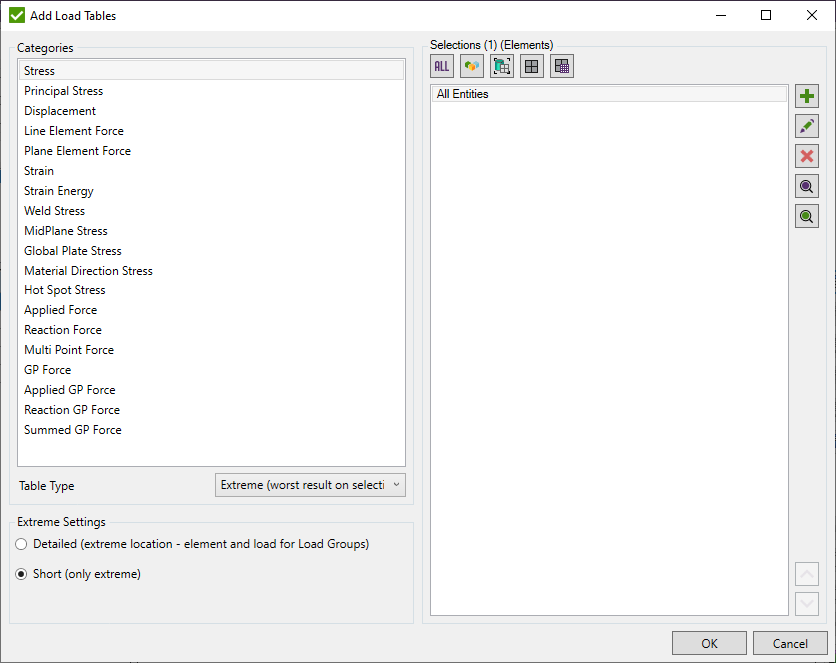
Select Table Type, Categories and Selections using Selection List Control to create tables of their combinations.
Expand and Extreme table settings are described in Expand/Extreme Table Chapter .
Note: For the nonlinear loads a separate table for each load result will be created.
Components Tables
A components extreme table displays extreme results for different selection for a single load. It is similar to a simple extreme table, however, in this table, the extreme results for several selections are displayed at once:
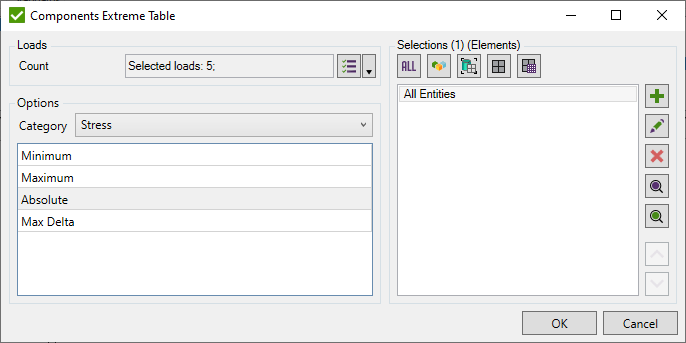
Select Loads, Category, Extreme Type and define Selections.
Summarized Forces (over nodes)
Summation table displays summed results for nodal results (applied/reaction forces) over selections for multiple loads:
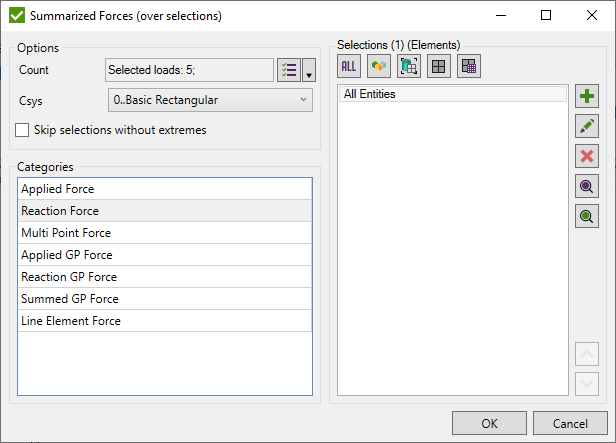
Select Loads, Category and define Selections.
Skip Rows without Extremes - depending on the Structure Type, selections or loads that do not contain a minimum or maximum value in any direction withing the load/selection will not be displayed in the table.
Flow Table (over loads)
Flow Table gives a possibility to see results in the selected elements or nodes for a few loads at once:
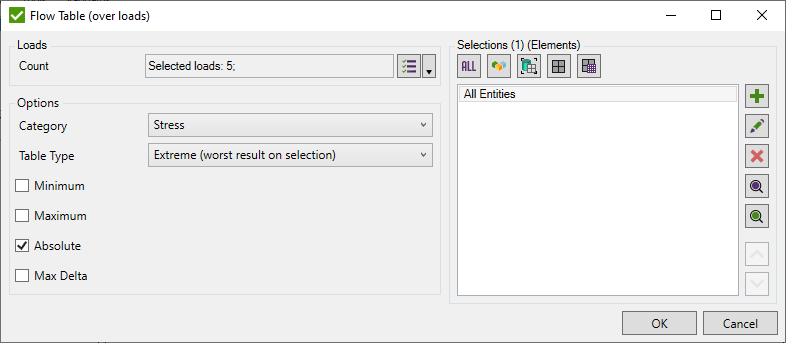
Select Loads, Category, Table Type (Expand/Extreme) and define Selections.
Expand and Extreme table settings are described in Flow Table Chapter.
Plots
Plots - create or import existing plots from Job:
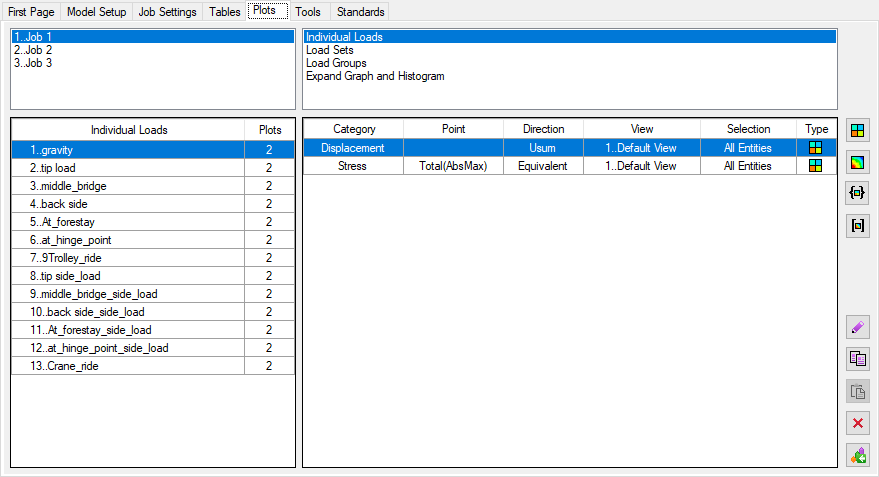
Select the Job and the Load Type, the table will be filled with correspondent loads. Common plots are shown for the selected loads.
Few plots can be modified at once using the context menu on top of correspondent columns.
Edit Criteria Options
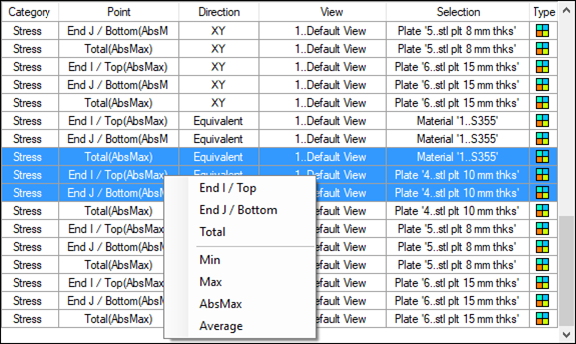
Edit Contour Options
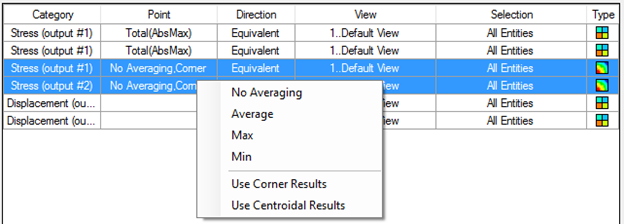
Edit Direction
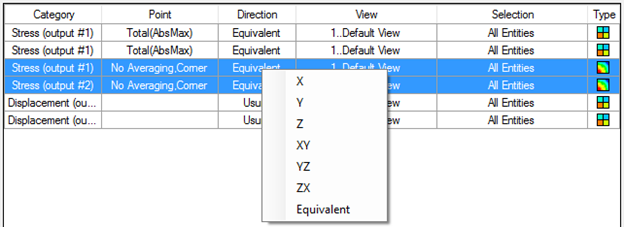
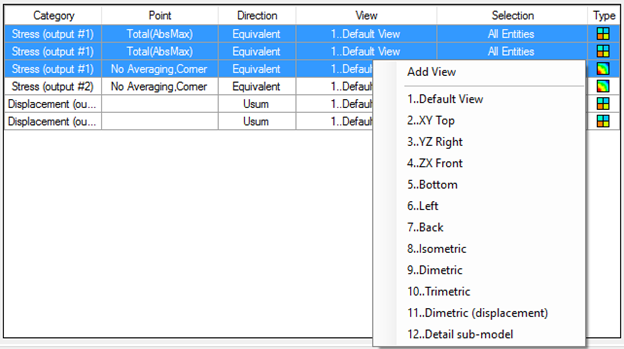
Edit View
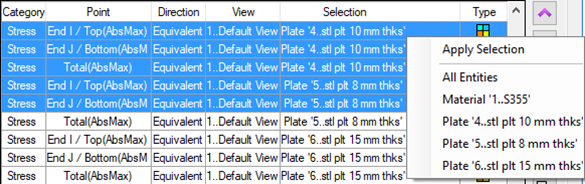
Edit Selection
- edit a single plot.
- import already existing plots from the selected Job (plots from selected Job and selected Load Type will be displayed).
Add Criteria/Contour Plot
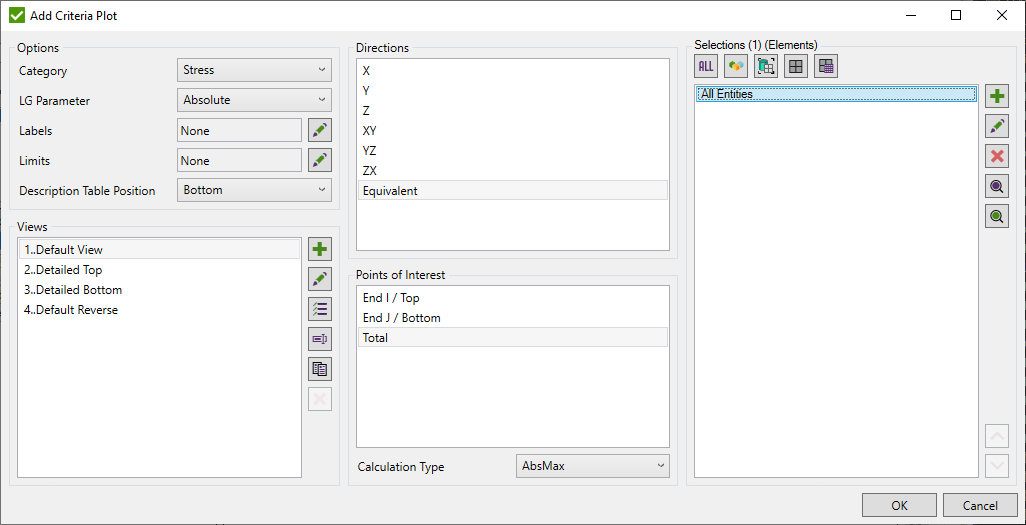
Select Result Category. Only for Load Groups it is possible to select the parameters (Min, Max, Abs, or Delta). Direction List depends on the Result Category.
Select position of the description table of the plot (top, bottom, none).
Select Views using Views List Control.
In the end define selections using Selection List Control.
All lists support multi-selection. The number of plots = combination of all selected parameters in all lists.
Criteria options
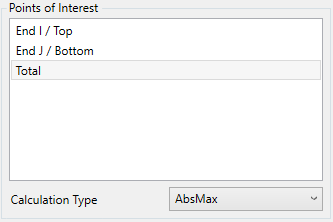
For stress, strains, line-, plane- and GP forces Point of Interest has to be defined.
Use Labels Control to include labels with extreme values over recognition items (members, plates, stiffeners or welds), display min/max values of the model or show coordinates of sections from Panel Finder.
To Filter elements/nodes based on results use Limits control.
Contour options
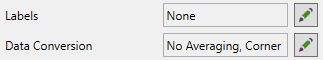
Define data conversion options using Data Conversion control.
Advanced Plots
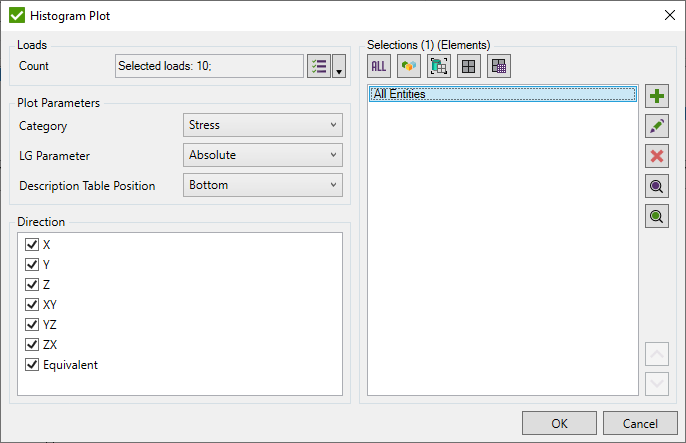
 – add an extreme Histogram:
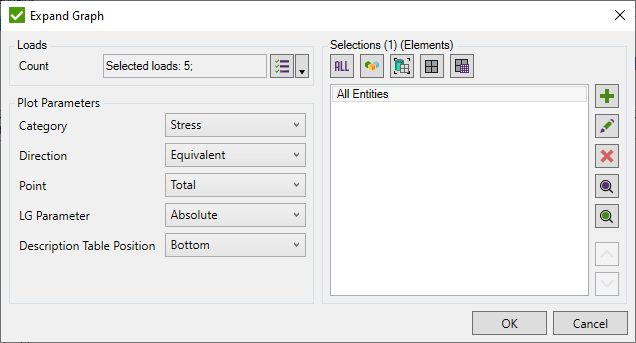
 – add an Expand Graph:
 – add a Beam Member Diagram:

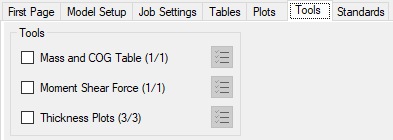
Tools
Tools - include tools created in the project:
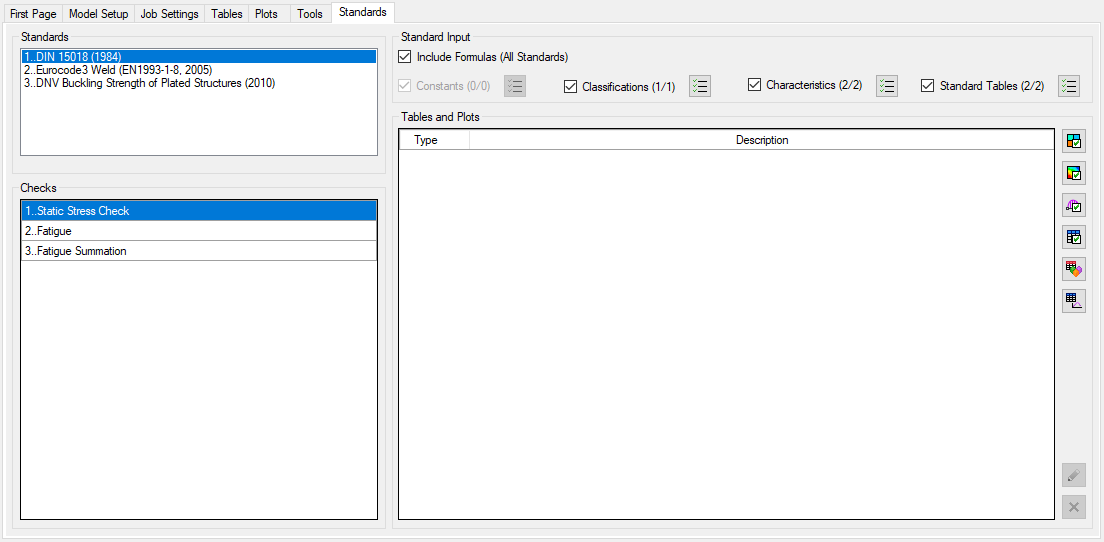
Standards
Standards - include standard input and results:
 - create a check criteria plot;
 - create a check contour plot;
- create a check beam member diagram plot;
 - create a check expand/extreme table;
 - create a check component extreme table;
 - create a check extreme flow table;
- edit an existing table/plot;
- remove the selected tables/ plots.
Custom Check Table
Custom Check Table - results for single load and single selection.
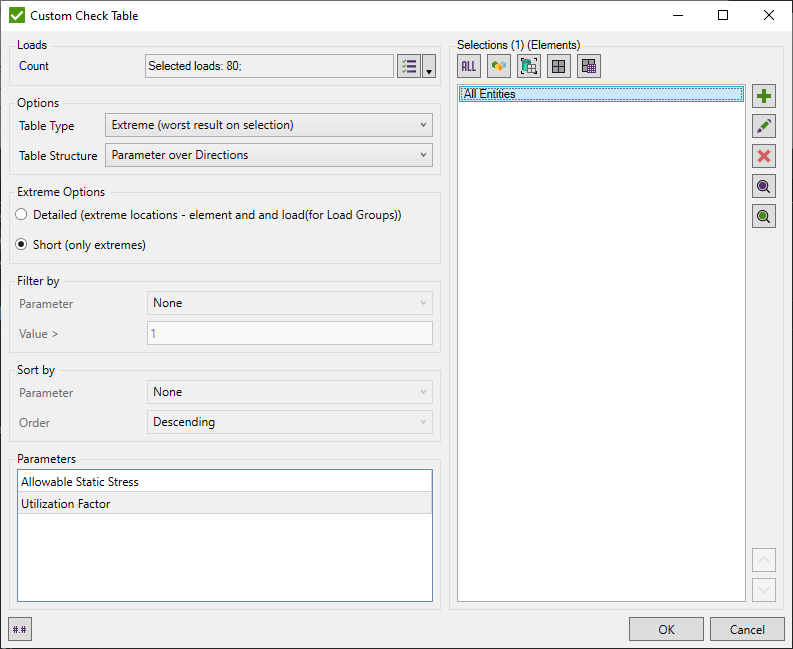
Note: Separate table for each load and each parameter table will be created with the defined selection.
Select Loads using Loads Selector.
Table Type - expand (show results for each node/element) or extreme (min/max/absolute max value over selection).
Table Structure - Parameter over Directions (results are shown for the selected parameter) or Direction over Parameters (results are shown for the selected direction);
Depending on the table type Expand Options or Extreme Options has to be defined.
Filter and sort results using Filter / Sort By control.
Define selections using Selection List Control.
 - define Number Format Settings for each parameter.
Custom Plate Buckling Tables
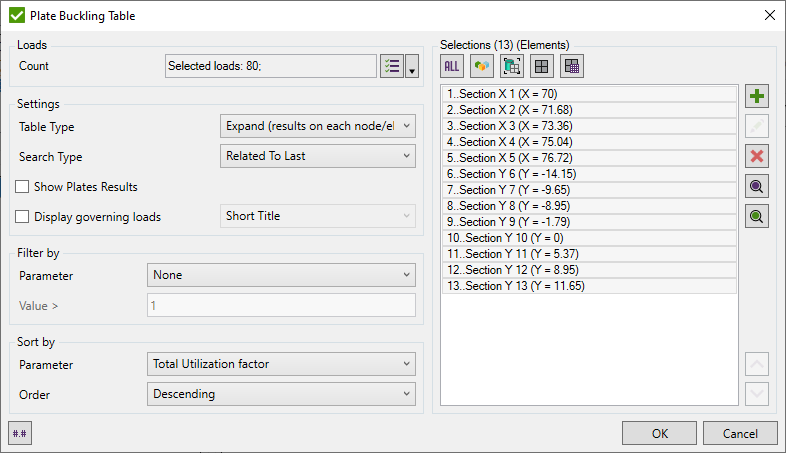
Select Loads using Loads Selector;
Table Type - expand (show results for each section/plate) or extreme (min/max/absolute max);
Show Plates Results - displays results over the plates for each section if turned off, displays results over the sections only, otherwise. Available for the expand table only.
Search type - results of the plate buckling are displayed over the plates. This option helps to display the results for each plate taking the worst result from all elements of the plate. Min, Max, Absolute max - the worst result is taken from all parameters of the check. Related to Last Parameter - the worst result will be taken only from the last parameter of the check.
Show Plates Results - displays results over the plates for each section if turned off, displays results over the sections only, otherwise. Available for the expand table only.
Display governing loads - for load groups displays governing load for the last parameter. Short Title (e.g. LS2) or Full Title (LS2..Combination2a_Inside).
Filter and sort results using Filter / Sort By control.
Define selections using Selection List Control. It is enough to pick one element from the section to include it into selection.
- define Number Format Settings for each parameter.
Weld Check Tables
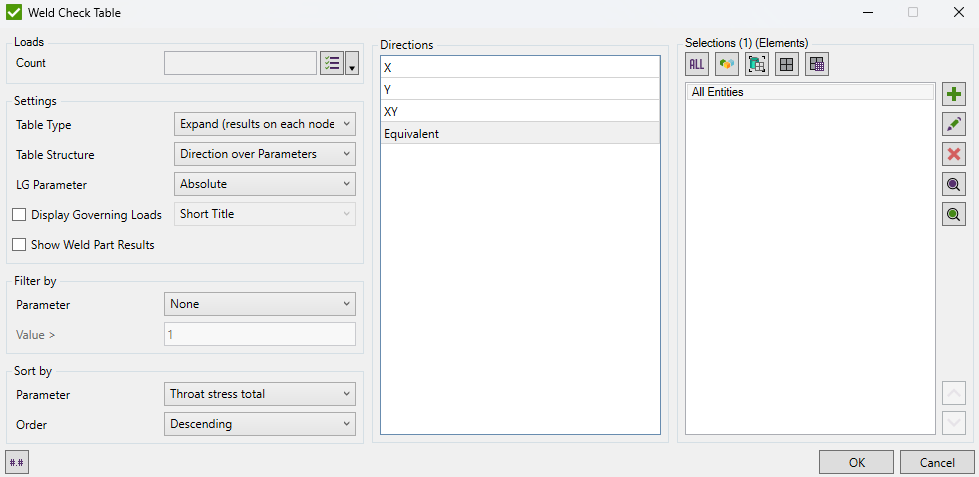
Select Loads using Loads Selector;
Table Type - expand (show results for each weld) or extreme (min/max/absolute max);
Table Structure - Direction over Parameters or Parameter over Directions;
LG Parameter - for load groups select Load Group Parameter (min/max/absolute max);
Display governing loads - for load groups displays governing load for the last parameter. Short Title (e.g. LS2) or Full Title (LS2..Combination2a_Inside).
Show Weld part Results - displays results over the weld parts for each weld if turned ON, displays results over the welds only, otherwise. Available for the expand table only.
Filter and sort results using Filter / Sort By control.
Define selections using Selection List Control.
Note: Welds will be found automatically from the selection using the weld finder tool during the table creation.
- define Number Format Settings for each parameter.
Connection Check Tables
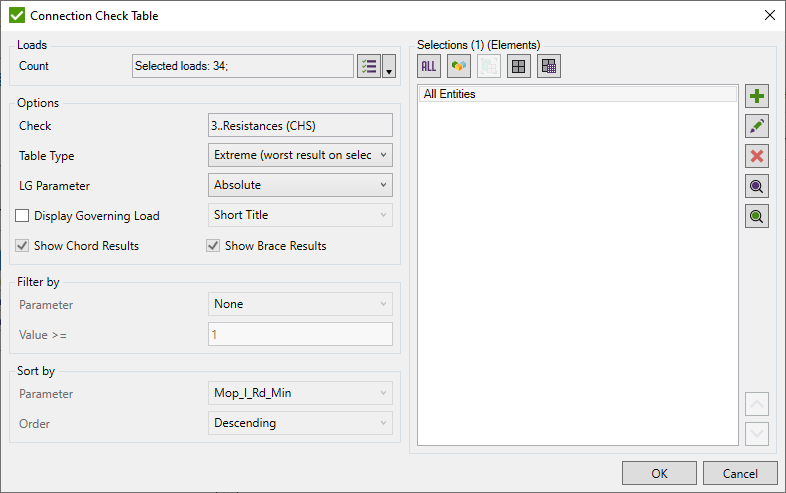
Select Loads using Loads Selector;
Table Type - expand (show results for each connection) or extreme (min/max/absolute max);
LG Parameter - for load groups select Load Group Parameter (min/max/absolute max);
Display governing loads - for load groups displays governing load for the last parameter. Short Title (e.g. LS2) or Full Title (LS2..Combination2a_Inside).
Show Chord Results - displays results for chord of each connection if turned ON. Available for the expand table only.
Show Brace Results - displays results over all braces of each connection if turned ON. Available for the expand table only.
Filter and sort results using Filter / Sort By control.
Define selections using Selection List Control.
Note: Connections will be found automatically from the selection using the connection finder tool during the table creation.
Fatigue Summation Tables
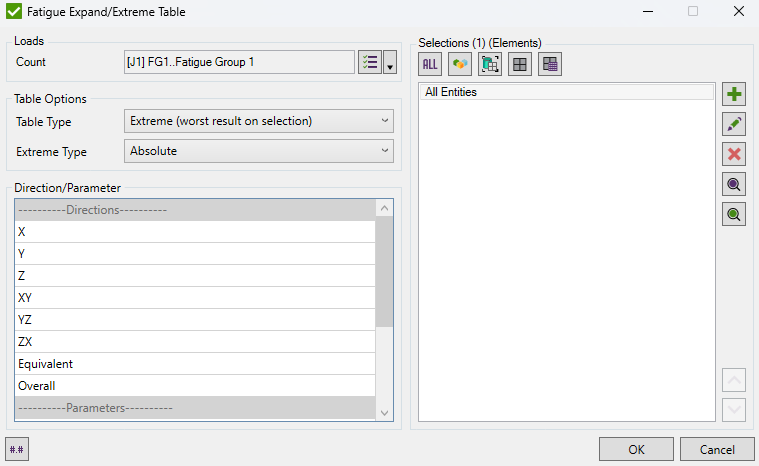
A Fatigue Table is different from a custom check table because the fatigue check has complex results (part of the parameters are calculated for Load Groups, other for Fatigue Group).
What results will be displayed depends on the Direction/Parameter option.
For the X direction:
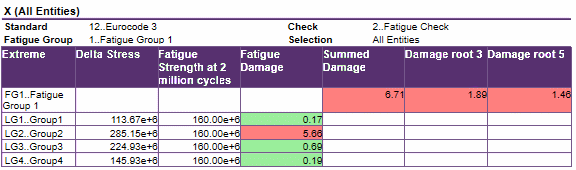
For the Delta Stress parameter is calculated only for Load Groups:
The Summed damage is calculated only for the Fatigue Group:
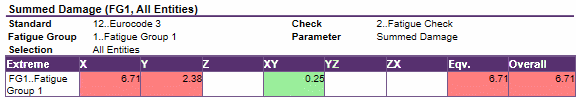
The structure of the expand table is similar except it is shown for each selected element separately.
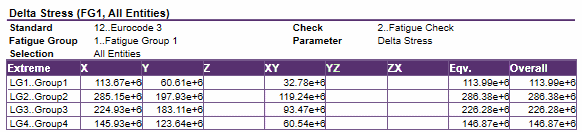
In the Extreme Flow Table it is possible to compare the results between the Fatigue Groups:
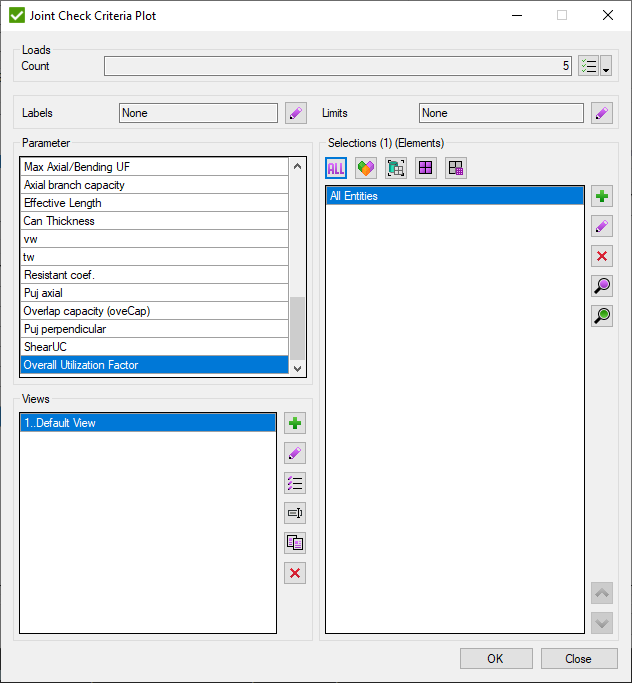
Joint Check Expand Tables
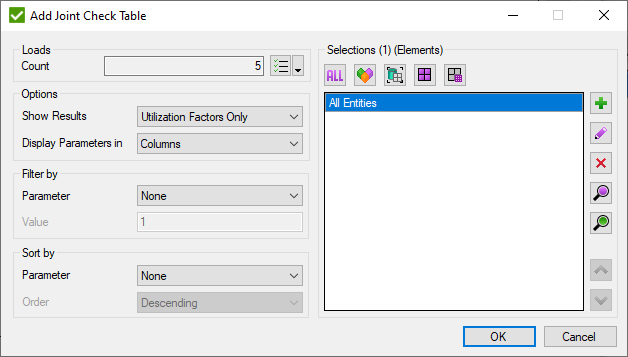
Select Loads using Loads Selector;
Display options are described in Joint Check Expand Table;
Filter and sort results using Filter / Sort By control;
Tables will be created for all selected selections (all joint connections will be included automatically from selection).
Joint Check Flow Table
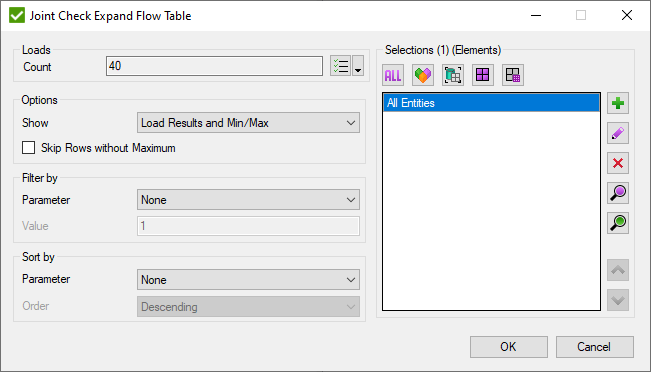
Select Loads using Loads Selector;
Display options are described in Joint Check Flow Table;
Filter and sort results using Filter / Sort By control;
Tables will be created for all selected selections (all joint connections will be included automatically from selection).
Number Formats for Checks
To configure number formats for checks press in the left bottom corner:
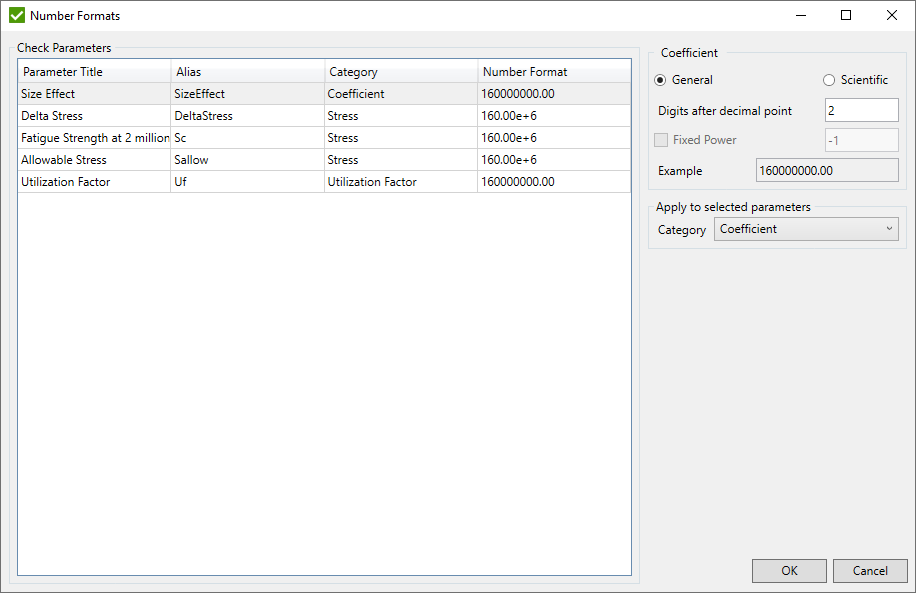
If selected parameters have the same category they are displayed in the number format control and can be modified. Otherwise, only a category for the selected parameter can be set.
Custom Check Plots
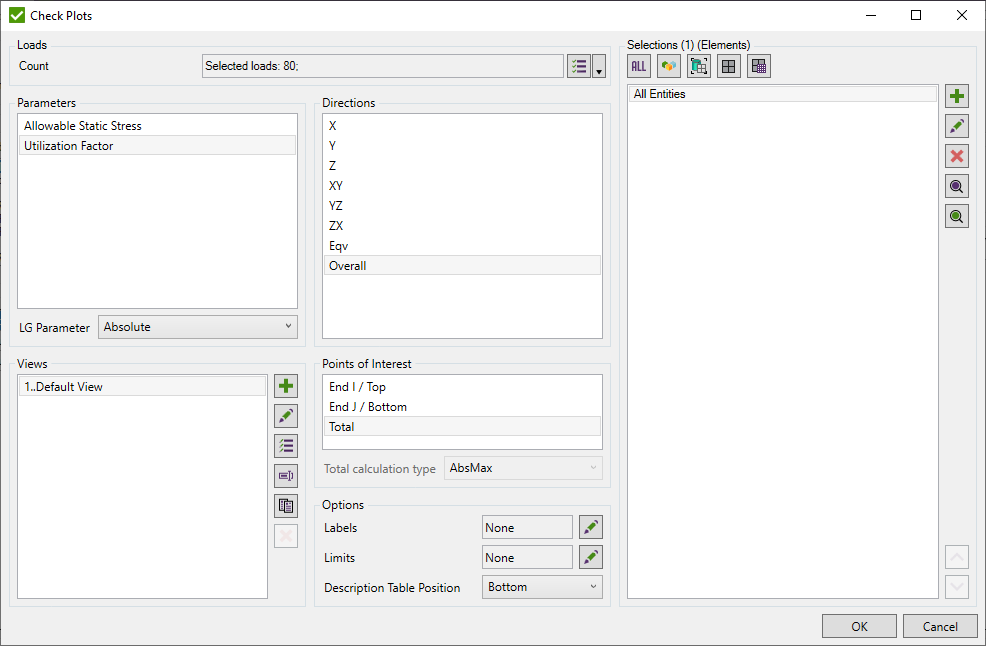
Select Loads using Loads Selector;
Select Views using View List;
Define selections using Selection List Control.
Use Label Control to include labels with extreme values over recognition items (members, plates, stiffeners or welds), display min/max values of the model or show coordinates of sections from Panel Finder.
To Filter elements/nodes based on results use Limits control.
Plate Buckling Check Plots
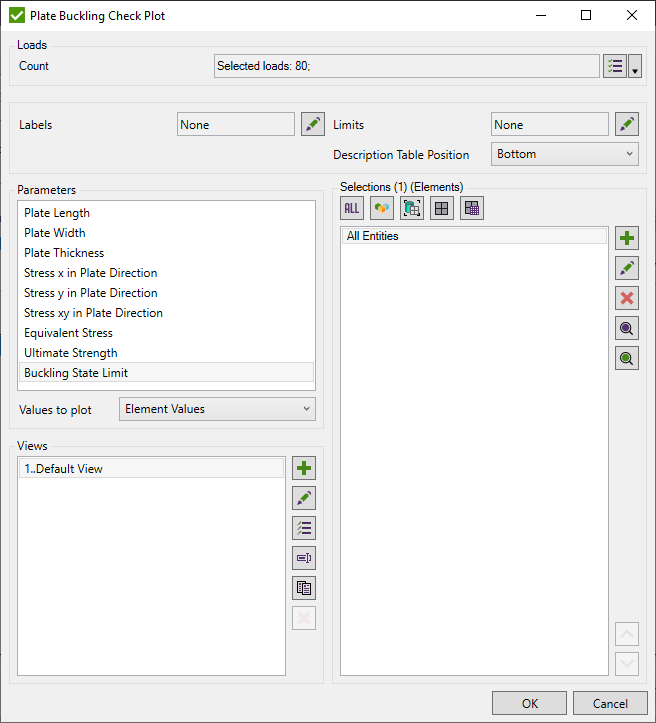
Select Loads using Loads Selector;
Select Views using View List;
Define selections using Selection List Control.
Values to Plot - can be used use for plotting: element values, min plate, max plate and average plate (the last 3 variants use one value for the full plate).
Use Label Control to include labels with extreme values over recognition items (members, plates, stiffeners or welds), display min/max values of the model or show coordinates of sections from Panel Finder.
Select position of the description table of the plot (top, bottom, none).
To Filter elements/nodes based on results use Limits control.
Weld Check Plots
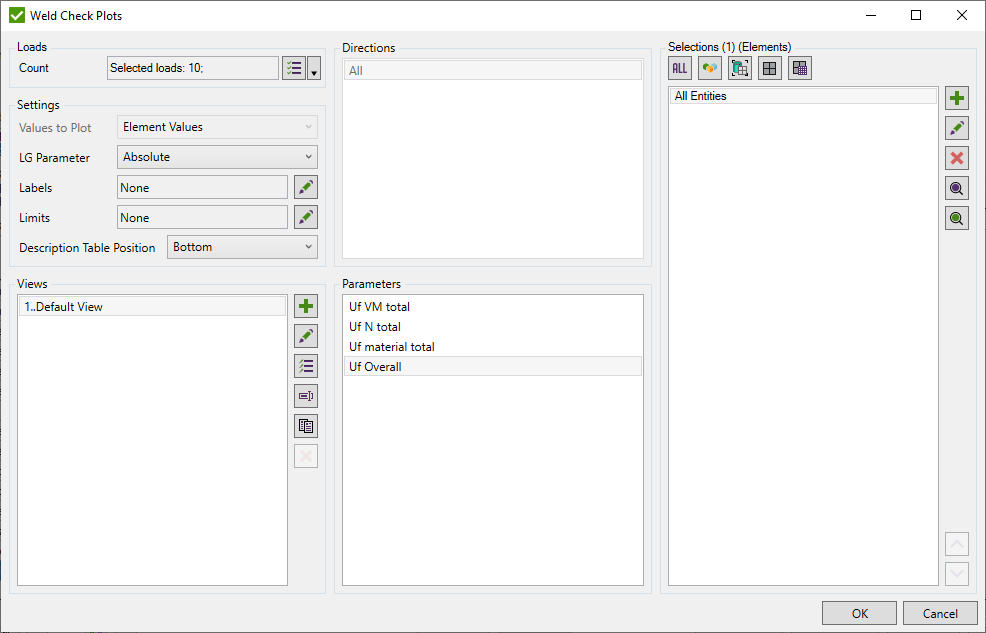
Select Loads using Loads Selector;
Select Views using View List;
Define selections using Selection List Control.
Note: Welds will be found automatically during the table creation.
Use Label Control to include labels with extreme values over recognition items (members, plates, stiffeners or welds), display min/max values of the model or show coordinates of sections from Panel Finder.
To Filter elements/nodes based on results use Limits control.
Connection Check Plots
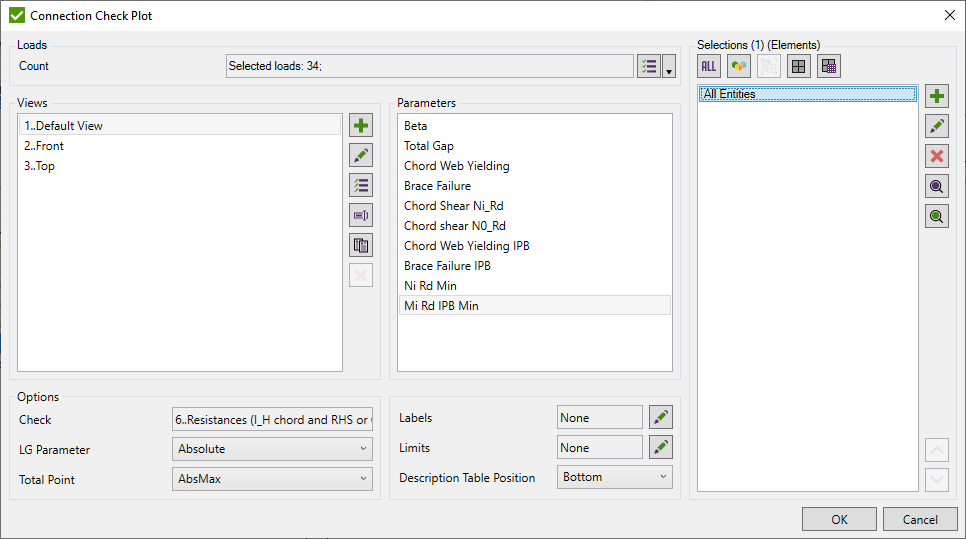
Select Loads using Loads Selector;
Select Views using View List;
Define selections using Selection List Control.
Note: Connections will be found automatically during the table creation.
Use Label Control to include labels with extreme values over recognition items (members, plates, stiffeners or welds), display min/max values of the model or show coordinates of sections from Panel Finder.
Select position of the description table of the plot (top, bottom, none).
To Filter elements/nodes based on results use Limits control.
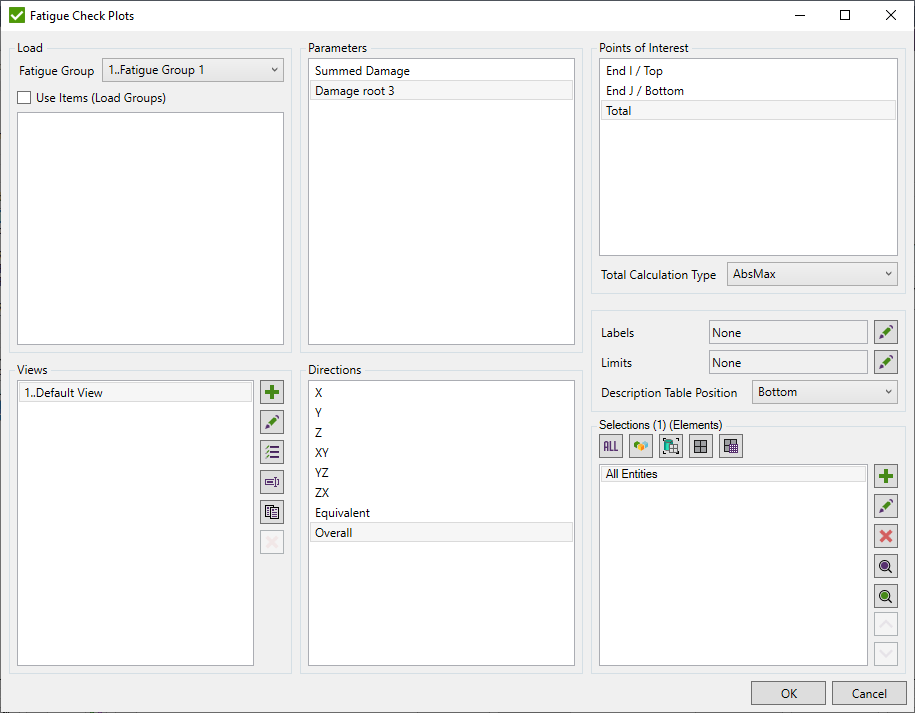
Fatigue Check Plots
The plots for fatigue summation checks are very similar to the plots for custom checks. The only difference is in the load selection. For fatigue group, it is possible to display only summation parameters (e.g. Summed Damage) and for Load Groups parameters that are calculated for every item (e.g. Delta Stress):
Joint Check Plots
Select Loads using Loads Selector;
Select Views using View List;
Use Label Control to include labels with extreme values over recognition items (members, plates, stiffeners or welds), display min/max values of the model or show coordinates of sections from Panel Finder.
To Filter elements/nodes based on results use Limits control.