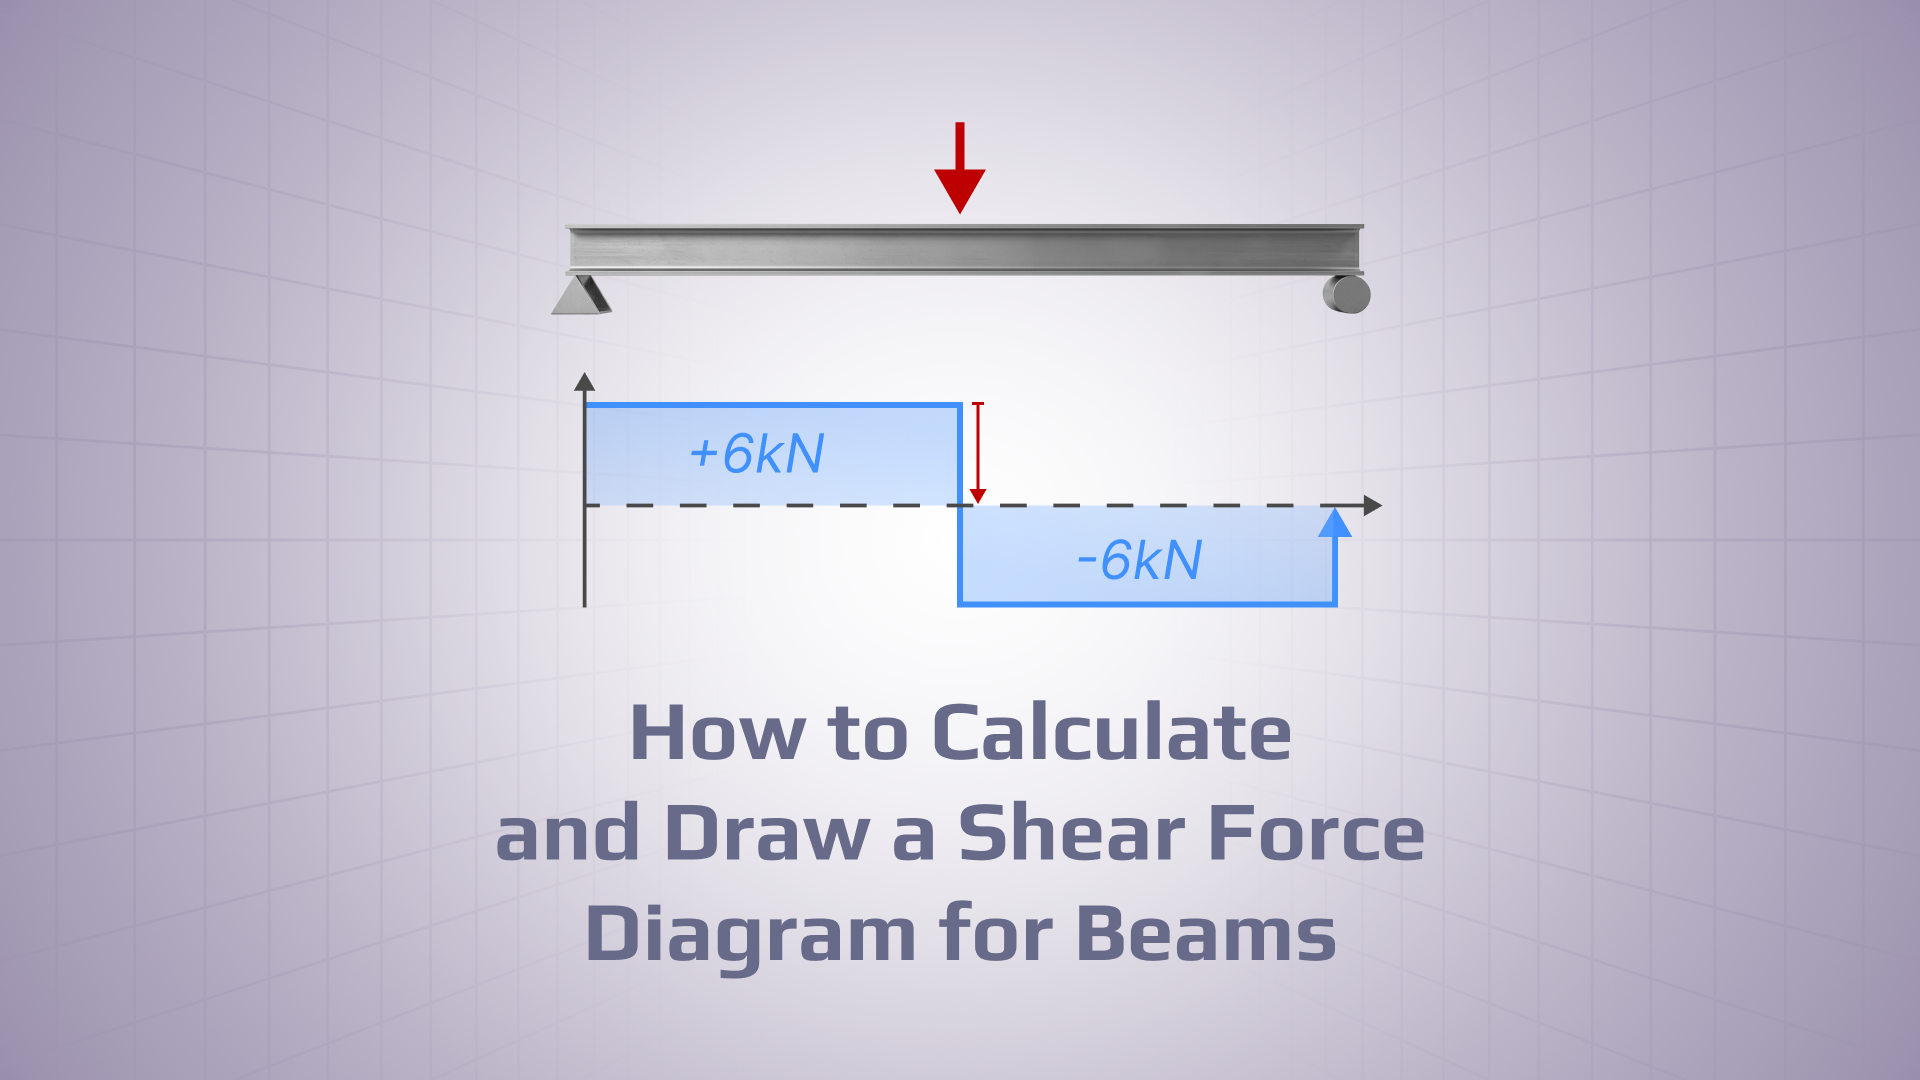
A shear force diagram shows how the internal shear force V(x) varies along the length of a beam. In practical terms, it shows how external loads and support reactions create internal transverse force at each section of the beam, depending on the distance from beam origin.
Engineers rely on the shear force diagram to identify critical points where shear forces reach their maximum values, verify the consistency of loading and support reactions, and cross-check the accuracy of bending moment diagrams. If the shear force distribution is wrong, the reactions, bending moment diagram, shear checks, and downstream verification results can all be affected.
In this article, you will learn how to construct a shear force diagram using equilibrium, sign convention, shear force equations, and step-by-step examples for simply supported and cantilever beams.
What Is a Shear Force Diagram?
A shear force diagram, or SFD, is a graph of the internal shear force along a beam. It shows where shear force is constant, where it changes gradually under distributed loads, and where it changes the magnitude because of point loads.
In this diagram, the horizontal axis (X-axis) represents the position along the beam length, while the vertical axis (Y-axis) represents the magnitude of the shear force, typically measured in units such as N, kN, lb, or kip. By plotting shear force V(x) at different sections, engineers can clearly see how the internal forces change from one point to another.
Image: A shear force diagram shows how internal shear force changes along the span of a beam.
The SFD is widely used not only for individual beams, but also for simplified analysis of structural members in frames and more complex systems.
Because different sign conventions exist, the convention should be defined before the diagram is drawn.
Shear Force vs Shear Stress vs Bending Moment
Shear force, shear stress, andbending momentdiagramsare related, but they are not the same result.
Term
Symbol
What it represents
Typical unit
Why it matters
Shear force
(V)
Internal transverse force at a beam section
N, kN, lb, kip
Used to find critical shear regions
Shear stress
(\tau)
Stress caused by shear force inside the section
MPa, psi
Used for material/section resistance checks
Bending moment
(M)
Internal couple causing bending
N·m, kN·m, kip·ft
Used for bending stress, deflection, and stability checks
In a typical beam workflow, the shear force diagram helpsidentifycritical shear regions, while thebending moment diagramis used to evaluate bending behavior and related stress checks.
Shear Force Sign Convention and Units
Before performing any shear, force calculation or drawing a shear force diagram, it is essential to define a sign convention and use it consistently throughout the entire analysis.
A common approach is to take positive shear force upward on the left side of a cut section (and downward on the right). However, alternative conventions also exist. The specific choice is less important than maintaining consistency—your shear force diagram will only be correct if the same convention is applied at every step.
A correctly constructed SFD must also satisfy global equilibrium. After all applied loads and vertical reactions are included, the cumulative shear should close back to zero. If it does not, there is likely an error in reactions, load values, sign convention, or shear equation.
When comparing hand calculations with finite element analysis (FEA) results, check the local element axes, output coordinate system, and sign convention used by the solver. A sign reversal may come from axis orientation, not from an actual difference in shear magnitude.
In terms of units, shear force is typically expressed in N or kN (SI units) or lb and kip (imperial units). The chosen unit system should remain consistent across the entire calculation and diagram.
Shear Force Equation: What Are You Actually Calculating?
At its core, the shear force equation comes directly from static equilibrium. For any section of a beam, the sum of vertical forces must equal zero:
\[
\sum F_y = 0
\]
From this, the equation for shear force at a given position (x) can be defined as:
\[
V(x) = \text{algebraic sum of vertical forces on one side of the cut}
\]
In practice, cut the beam at (x), take one side of the section, and sum up the vertical forces using the selected sign convention.
Beyond this basic definition, shear force is part of a continuous relationship with distributed load and bending moment:
\[
\frac{dV}{dx} = -w(x)
\]
\[
\frac{dM}{dx} = V(x)
\]
These relationships explain how SFDs are formed:
A distributed load w(x) causes the shear force to vary along the beam
The shear force diagram slope is controlled by the load magnitude
The bending moment diagram is directly derived from the shear force diagram
How to Draw a Shear Force Diagram Step by Step
To correctly construct an SFD, follow a consistent left-to-right process while applying equilibrium, sign convention, and load behavior rules:
Draw the beam, supports, and all applied loads.
Calculate support reactions using equilibrium equations.
Choose and state the sign convention for shear force.
Move along the beam from left to right.
Apply vertical jumps at reactions and point loads.
Draw sloped lines under uniformly distributed loads.
Keep shear constant across unloaded beam segments.
Check that the diagram closes back to equilibrium.
Use the shear force diagram to support the bending moment diagram.
Shear Force Diagram Shapes by Load Type
Different typesof loads produce characteristic shapes in a shear force diagram. Recognizing these patterns makes it much easier to draw and verify the diagram correctly during shear force calculation.
Beam/load condition
What happens in the SFD
Engineering meaning
Point load
Vertical jump
Shear changes suddenly at the load location
Support reaction
Vertical jump
Reaction adds or subtracts from cumulative shear
No distributed load
Horizontal line
Shear is constant over that segment
Uniform distributed load
Straight sloped line
Shear changes linearly
Linearly varying load
Curved/parabolic shear line
Shear changes nonlinearly
Applied moment
No jump in shear
Moment affects BMD, not SFD directly
Example 1 — Simply Supported Beam with a Central Point Load
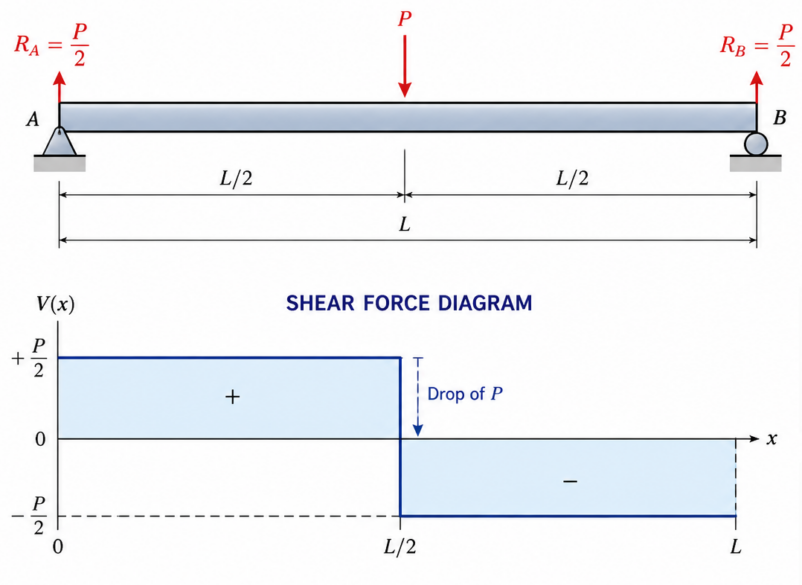
Consider a simply supported beam with a 6 m span and a 12 kN point load at midspan.
Given:
Span: L = 6m
Point load: P = 12 kN at midspan
Result: the SFD is +6 kN from A to midspan, drops by 12kN, then remains at -6kN until support B.
Image: A central point load creates a vertical jump in the shear force diagram equal to the load magnitude.
Results:
Constant positive shear from A to the load
A vertical drop at midspan equal to the load magnitude
Constant negative shear from the load to B
Return to zero at the right support
Example 2 — Shear Force Diagram for a Simply Supported Beam with Uniformly Distributed Load
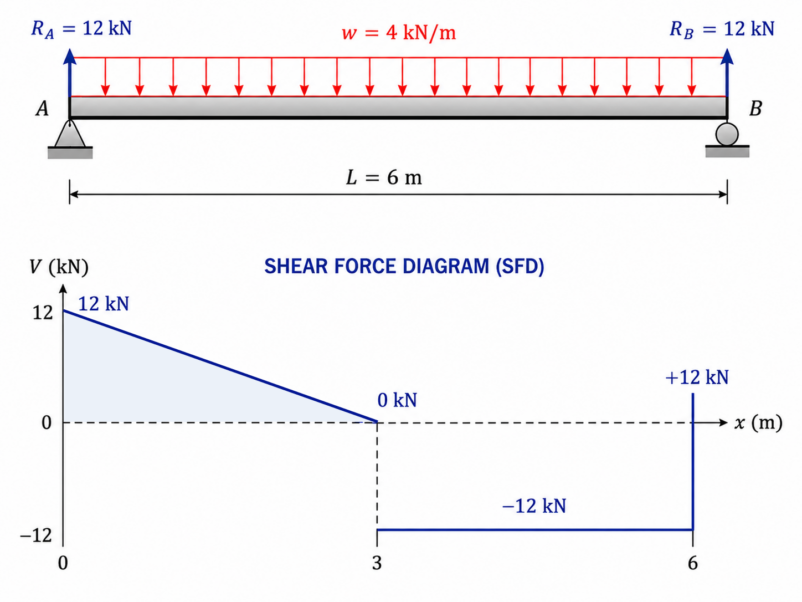
This example shows a basic shear force calculation for a simply supported beam subjected to a uniformly distributed load (UDL). It is a common case used to explain how to calculate shear force on a beam and how distributed loads affect the shape of the SFD.
Given:
Span: L = 6m
Uniformly distributed load: w = 4 kN/m
Result: the SFD starts at (+12,kN) at the left support and decreases linearly under the uniformly distributed load. After the distributed load ends, the diagram becomes horizontal because no additional load acts on the beam in that region. At the right support, the (+12,kN) reaction causes a vertical jump in the SFD back to zero.
Image: A uniformly distributed load creates a linear shear force diagram
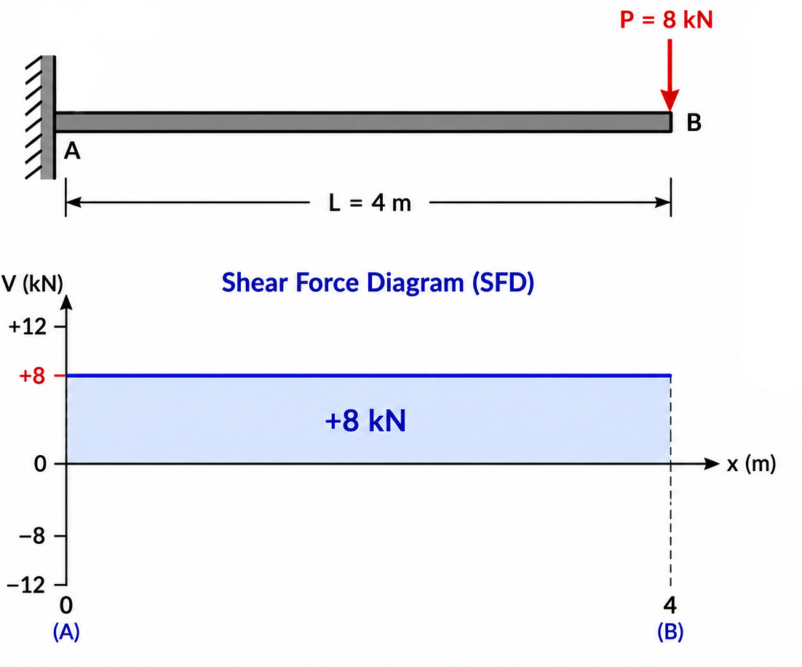
Example 3 — Shear Force Diagram for a Cantilever Beam with an End Point Load
This example demonstrates a diagram for a cantilever beam subjected to a concentrated load at the free end. Unlike a simply supported beam, a cantilever transfers all vertical load directly to the fixed support.
Given:
Cantilever length: L=4 m
End point load: P=8 kN
Result: With no distributed load between the free end and the fixed support, the internal shear force remains constant along the span. Therefore, the SFD is rectangular and maintains a constant value of +8 kN along the entire length.
Image: Cantilever with end load and rectangular SFD
Example 4 — Shear Force Diagram for a Cantilever Beam with Uniformly Distributed Load
This example shows how a uniformly distributed load affects the shear force diagram for a cantilever beam. Unlike a concentrated load, a distributed load causes the shear force to vary continuously along the beam length.
Given:
Cantilever length: L=4 m
Uniformly distributed load: w=3 kN/m
Result: The shear force diagram starts at 0 kN at the free end, changes linearly along the beam due to the uniformly distributed load, and reaches +12 kNat the fixed support, forming a triangular diagram.
Shear Force and Bending Moment Diagrams: How They Work Together
In beam analysis, the SFD and bending moment diagram (BMD) are typically developed together because they describe the same structural behavior from different perspectives.
The key relationship is that shear force represents the slope of the bending moment diagram. In practical terms, this means:
Where shear force is positive, the bending moment increases
Where shear force is negative, the bending moment decreases
Where shear force crosses zero, the bending moment usually reaches a local maximum or minimum
Because of this, the shear force diagram is often used to verify and interpret the bending moment distribution. It helps engineers quickly identify critical regions where internal forces—and therefore stresses—are highest.
Once the SFD is correct, the next step is usually the bending moment diagram, which shows how the internal bending moment changes along the beam.
Common Mistakes When Calculating Shear Force Diagrams
Even simple shear force calculations can produce incorrect results if the underlying assumptions or diagram logic are inconsistent. Many errors in structural verification come not from advanced analysis, but from small mistakes in how the shear force diagram is constructed and interpreted.
Some of the most common issues include:
Forgetting support reactions: A diagram cannot be drawn correctly until all support reactions are calculated from equilibrium.
Mixing sign conventions: Switching between different positive/negative shear definitions during the calculation leads to inconsistent results and incorrect diagram shapes.
Using the UDL resultant correctly for reactions but then drawing the SFD as if the UDL were a point load. A UDL creates a sloped shear line, not a single vertical jump.
Not splitting the beam at load changes: Every change in loading condition requires a new segment in the shear force equation.
Forgetting that point loads create jumps, not slopes: Concentrated forces change shear instantly, producing vertical steps in the diagram.
Expecting every diagram to “look positive”: Negative shear values are completely normal and depend on both loading and sign convention.
Comparing hand-calculated local shear with FEA output in another coordinate system: Finite element software may use different local or global axes, causing sign reversals that are not actual calculation errors.
Ignoring load combinations when interpreting maximum shear: In real engineering projects, critical shear force often comes from governing load combinations—not from a single isolated load case.
From Hand Calculation to FEA Results and SDC Verifier
Hand calculations are useful for learning beam behavior and checking whether results are physically reasonable. But real verification workflows usually involve many load cases, combinations, element types, coordinate systems, and reporting requirements. In that context, manually creating and comparing shear and moment diagrams becomes slow and error-prone.
SDC Verifier includes a Moment & Shear Force tool that integrates grid-point forces along a selected reference line to generate longitudinal shear and moment diagrams directly from FEA results. Engineers can extract minimum and maximum values across multiple load sets, compare results consistently, and export plots and tables for reporting and documentation purposes.
This reduces reliance on disconnected spreadsheets, manual plots, and inconsistent result extraction.
Calculate Shear and Moment Diagrams Directly from FEA Results
Use SDC Verifier to make structural verification faster, more consistent, and easier to document.
A shear force diagram is a graph that shows how internal shear force changes along the length of a beam. It helps engineersidentifywhere shear force is highest and where the diagram changes because of point loads, distributed loads, or support reactions.
What is the formula for shear force?
For a cut at positionx, shear force is the algebraic sum of vertical forces on one side of the cut. In distributed-load form, \[\frac{dV}{dx} = -w(x)\]
How do you draw a shear force diagram?
Calculate reactions, choose a sign convention, move along the beam, apply jumps at point loads/reactions, slopes under distributed loads, and check equilibrium.
What is the difference between shear force and bending moment?
Shear force is a transverse internal force. Bending moment is an internal couple that causes bending. In beam theory, \[\frac{dM}{dx} = V\]
Where is maximum shear force in a beam?
Usually near supports or concentrated loads, depending on support conditions and load arrangement.
Does a point load create a jump in the shear force diagram?
Yes. A point load creates a vertical jump in the SFD equal to the loadmagnitude.
Does a uniformly distributed load create a straight or curved shear diagram?
A uniformly distributed load creates a straight slopedshear force diagrambecause the load intensity is constant. A linearly varying distributed load creates a curvedSFD.
Can shear force be negative?
Yes. Negative shear force simply means the internal shear acts opposite to the selected positive sign convention. It does not automatically mean the calculation is wrong.
What does it mean when shear force is zero?
In many beam problems, a zero-shear locationindicateswhere the bending moment may reach a local maximum or minimum. This is whySFDs are often used together with bending moment diagrams.