A steel beam may look perfectly rigid, but under load, it is always deforming, even if the deformation is too small to see. The important question is not whether a material deforms, but how it behaves as the load increases.
This is where the stress-strain curve becomes essential. It shows how a material’s mechanical response changes as loading increases, revealing when deformation remains reversible and when permanent deformation begins. Engineers use this relationship to understand material strength, stiffness, ductility, and failure behavior — and as an input for predicting how structures respond under load.
Understanding what each region in a stress strain curve means helps engineers choose appropriate material models, interpret FEA results, and make informed decisions about structural safety and performance.
What Is Stress and Strain?
When an external load is applied to a material, internal forces develop within it, causing the material to deform. Stress describes the intensity of these internal forces, while strain describes the resulting deformation. Together, they show how a material responds to loading.
Stress: Definition and Formula
Stress describes the intensity of internal forces within a material. For a simple uniaxial tensile test, the average engineering stress is calculated by dividing the applied axial force by the specimen’s original cross-sectional area. It describes how much load is carried by a particular area of the material.
For a simple uniaxial tensile load, engineering stress is calculated as:
σ = F / A₀
where:
σ is the engineering stress, usually measured in MPa or Pa
F is the applied force
A₀ is the material’s original cross-sectional area
For example, if a tensile force is applied to a steel specimen, the stress indicates how intensely the material is being loaded relative to its original cross-sectional area.
Stress can be tensile or compressive depending on the direction of the applied load. In more complex loading conditions, materials can also experience shear stress.
Strain: Definition and Formula
Strain measures how much a material deforms relative to its original dimensions. Strain is a dimensionless quantity because it represents a ratio rather than an absolute measurement.
For axial loading, engineering strain is calculated as:
ε = ΔL / L₀
where:
ε is the engineering strain
ΔL is the change in length
L₀ is the original gauge length
Strain is often expressed as a decimal or percentage. For example, a strain of 0.002 corresponds to 0.2% deformation.
The relationship between stress and strain is what makes the stress-strain curve so useful. By plotting stress on the vertical axis and strain on the horizontal axis, engineers can see how a material transitions from elastic behavior to yielding, plastic deformation, and eventually failure.
How to Read a Stress-Strain Curve (Labeled Diagram)
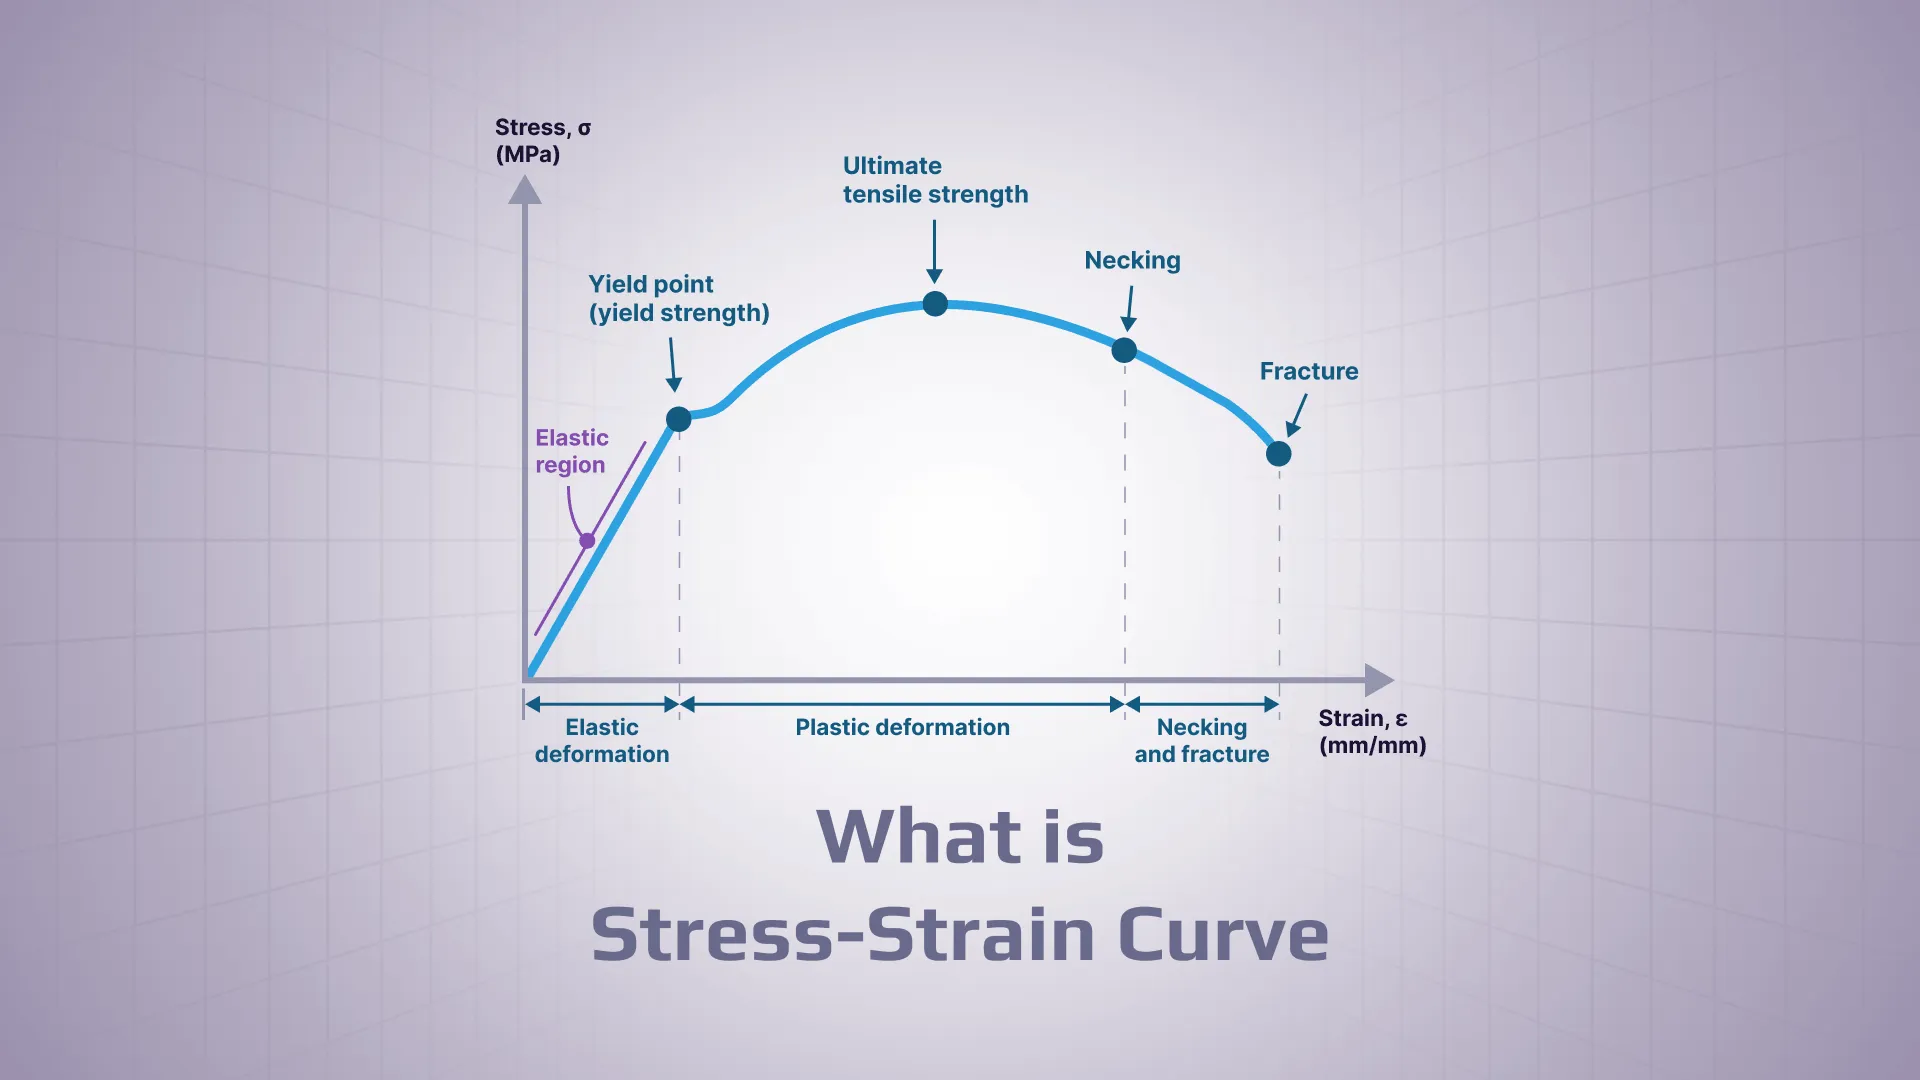
In a standard stress-strain diagram:
the vertical axis (Y-axis) represents stress;
the horizontal axis (X-axis) represents strain.
The curve is usually obtained from a tensile test, in which a material specimen is gradually pulled until it fractures. As the applied force increases, the testing equipment records both the load and the resulting deformation. These measurements are then used to plot the stress-strain relationship.
Graph: Stress-strain curve for a ductile material
Parts of a Stress-Strain Curve
Elastic Region
The elastic region is the initial part of the stress-strain curve, where deformation is reversible. Within this range, the material recovers its original dimensions after the load is removed.
For many engineering materials, the early portion of this region is approximately linear. Within the linear proportional region, the slope of the curve is Young’s modulus:
E = Δσ / Δε
For a linear relationship starting from the origin, this reduces to E = σ/ε.
A steeper slope indicates a stiffer material, meaning that a greater stress is required to produce the same amount of strain.
Proportional and Elastic Limits
The proportional limit marks the end of the region where stress and strain are directly proportional. Up to this point, the material follows Hooke’s law:
σ = Eε
Beyond the proportional limit, the stress-strain relationship may no longer be perfectly linear.
The elastic limit represents the maximum stress a material can withstand without experiencing permanent deformation. If the load exceeds this limit, some deformation remains after unloading.
Yield Point and Yield Strength
The yield point marks the transition at which significant permanent deformation begins.
Some materials, particularly certain types of steel, exhibit a clearly defined yield point on the stress-strain curve. Other materials transition gradually from elastic to plastic behavior and do not have a distinct point.
In these cases, engineers use yield strength instead. It is often determined using the 0.2% offset method, which defines the stress required to produce a specified amount of permanent strain.
Plastic Deformation
After yielding, deformation becomes permanent. In many ductile materials, continued loading produces strain hardening, so progressively higher stress is required as plastic strain develops. The extent of this region is an important indicator of ductility.
Ultimate Tensile Strength
The ultimate tensile strength (UTS) is the maximum engineering stress reached during a tensile test.
Up to this point, the material can continue carrying increasing load. After reaching the ultimate tensile strength, deformation becomes localized, and the specimen begins to lose its ability to uniformly resist the applied load.
It is important not to confuse ultimate tensile strength with yield strength: Yield strength marks the onset of significant permanent deformation, whereas UTS is the maximum engineering stress reached during the test.
Necking
Necking begins after the material reaches its ultimate tensile strength. Instead of deforming uniformly along its length, deformation becomes concentrated in a localized area.
After necking begins, the load carried by the specimen eventually decreases. Because engineering stress is calculated as F/A₀ using the constant original area, the engineering stress therefore drops. True stress uses the shrinking instantaneous area at the neck and may continue to increase..
Fracture Point
The fracture point is the final point on the curve, representing the moment when the material breaks.
The amount of strain at fracture provides information about the material’s ductility. A material that undergoes substantial deformation before breaking is generally considered more ductile, while a material that fractures with little deformation is considered more brittle.
Engineering vs True Stress-Strain Curve
The two most common ways to describe tensile-test data are engineering stress-strain and true stress-strain. The distinction matters when preparing material data for nonlinear FEA, because the solver may require the material response in terms of the actual stress and strain experienced by the specimen as it deforms.
Image: Engineering vs. true stress strain curve
The engineering stress-strain curve uses the specimen’s original dimensions throughout the test:
Engineering stress: σ = F / A₀
Engineering strain: ε = ΔL / L₀
The true stress-strain curve accounts for the specimen’s changing dimensions during deformation:
True stress: σ_true = F / A, where A is the instantaneous cross-sectional area.
True strain: ε_true = ln(L / L₀), where L is the instantaneous gauge length.
Before necking, engineering tensile-test data can often be converted to true stress and true strain using the usual uniform-deformation relationships. After necking begins, however, deformation becomes non-uniform, so a simple conversion is no longer sufficient to determine the local true material response.
Stress-Strain Curves for Different Materials
The shape of a stress-strain curve depends strongly on the material’s microstructure, composition, and mechanical properties.
Steel
A typical steel stress-strain curve has a steep initial slope because structural steels have a high Young’s modulus, typically around 200 GPa. Many structural steels also show a distinct yield point or yield plateau, followed by plastic deformation and strain hardening until the curve reaches its ultimate tensile strength.
The exact curve depends on the steel grade. Higher-strength steels generally have higher yield and tensile strengths, but their ductility and post-yield behavior can differ from conventional structural steels. The large plastic region of ductile steel is particularly important in structural engineering because it allows components to deform and redistribute loads before fracture.
Aluminum
An aluminum stress-strain curve generally has a lower initial slope than steel because aluminum alloys have a lower Young’s modulus, typically around 70 GPa. Unlike some structural steels, aluminum alloys usually do not have a clearly defined yield point, so yielding is commonly characterized using a proof stress, such as the 0.2% offset yield strength.
Aluminum alloys can still undergo significant plastic deformation before fracture, depending on the alloy and temper. Their lower stiffness also means that an aluminum component will generally experience greater elastic deformation than a geometrically similar steel component under the same load.
Brittle Materials
Brittle materials, such as ceramics, glass, and gray cast iron, and some hardened materials, typically show little plastic deformation before fracture.
Their stress-strain curves often have a relatively short nonlinear or plastic region compared with ductile metals. Once the material approaches fracture, fracture can occur with relatively little additional strain.
How Is the Stress-Strain Curve Used in FEA?
In finite element analysis (FEA), the stress-strain curve connects experimentally determined material behavior with the constitutive model used by the solver.
For a linear elastic analysis, the material can often be described using a small number of properties, such as Young’s modulus and Poisson’s ratio. Once plastic deformation becomes relevant, the material definition needs to describe how stress evolves as strain increases beyond the elastic range.
Linear and Nonlinear Material Behavior
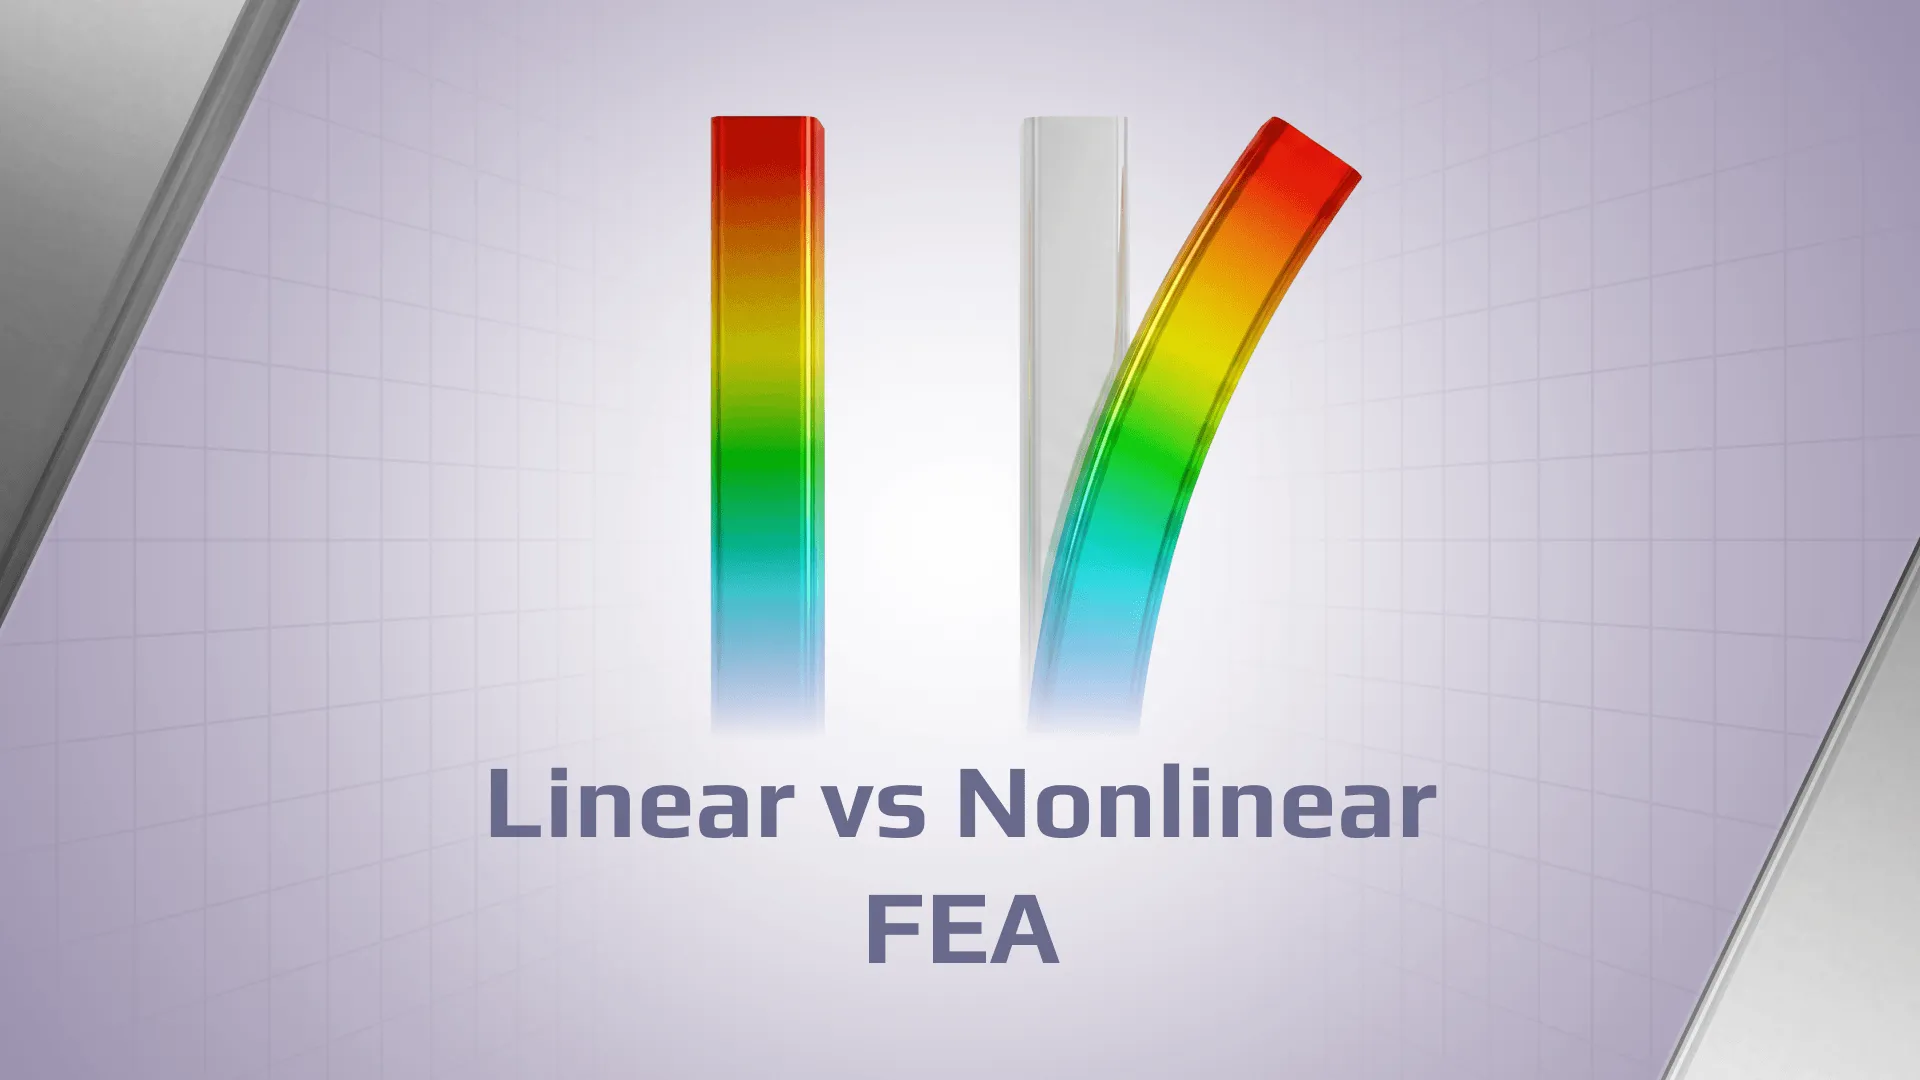
In a linear material model, stress is proportional to strain and the material returns to its original configuration when the load is removed. For isotropic linear elasticity, the primary material parameters are Young’s modulus and Poisson’s ratio.
A linear-elastic material model is appropriate while the material response remains within the elastic range and stress is approximately proportional to strain. Whether large-displacement or other geometric nonlinear effects must also be considered is a separate modeling decision.
Material nonlinearity is not the same as geometric nonlinearity. Plasticity comes from nonlinear material behavior, while large-displacement effects arise from changes in geometry during loading. A model may contain either or both.
A nonlinear material model is required when the stress-strain relationship changes significantly during loading. Plasticity is one of the most common sources of material nonlinearity. In an elastic-plastic material model, the stress-strain data is used together with a plasticity formulation – including a yield criterion and hardening behavior – to determine how the material responds as plastic strain develops.
Defining Material Properties
The stress-strain curve is used to define how a material responds once the elastic range has been exceeded.
For a basic isotropic linear-elastic material model, the primary constitutive properties are:
Young’s modulus
Poisson’s ratio
Other properties may be required depending on the analysis. For example, density is needed for mass-dependent analyses, while yield strength is used to assess whether the linear-elastic assumption remains appropriate and for subsequent strength or code checks.
For an elastic-plastic analysis, additional stress-strain data is typically required to describe the material’s post-yield response. Depending on the solver and material formulation, this may be provided as a stress versus plastic strain curve or another constitutive representation.
A material curve obtained under one temperature, strain rate, or loading condition may not accurately represent behavior under substantially different conditions.
Do not assume that a raw engineering stress-strain curve can be entered directly into a nonlinear FEA material model. Solver requirements differ. Many plasticity formulations use true stress together with plastic strain rather than engineering stress and total engineering strain. The material data should therefore be converted and prepared according to the solver’s constitutive-model requirements.
Stress-Strain Curve vs FEA Stress-Strain Results
A material stress-strain curve and FEA stress-strain results describe related but different things. The material curve is typically obtained from testing and defines how the material responds to loading. The FEA results show how that material behaves within an actual structure, based on its geometry, loads, boundary conditions, contacts, mesh, and analysis type.
For example, the material curve may define the stress at which steel begins to yield, while FEA can show where that stress is reached in a bracket, weld, bolt hole, or other stress concentration.
From Material Properties to Structural Verification
The tensile test provides data used to characterize yielding and post-yield behavior. In an FEA model, the solver evaluates the local multiaxial stress state according to the selected constitutive model and yield criterion, allowing engineers to identify where yielding and plastic strain develop.
In an engineering analysis, material properties are combined with the component’s geometry, loads, boundary conditions, connections, and relevant design requirements. FEA can then be used to calculate stresses, strains, displacements, reactions, and other structural responses.
The next step is verification: comparing those calculated responses with the limits defined by the applicable design standard or engineering criteria.
For example, a structural analysis may determine the stress distribution in a steel component, while a verification procedure checks whether the resulting utilization remains within the allowable limit. Depending on the application, verification may also involve buckling, fatigue, welds, plates, joints, or other failure modes.
This is where dedicated structural verification software can reduce the amount of manual work between FEA results and engineering checks. SDC Verifier combines FEA post-processing with code-based structural verification and supports 60+ international standards, helping engineers move from calculated structural response to documented verification results.
The stress-strain curve therefore represents one link in a larger engineering process: material behavior → FEA response → code checks → structural verification.
FAQs
What does a stress-strain curve show?
A stress-strain curve shows the relationship between the stress applied to a material and the resulting strain. It can be used to identify important mechanical properties and stages of deformation, including elastic behavior, yielding, plastic deformation, ultimate tensile strength, necking, and fracture.
What is the difference between engineering and true stress-strain curves?
An engineering stress-strain curve calculates stress and strain using the specimen’s original dimensions. A true stress-strain curve accounts for the dimensions as they change during deformation. The difference becomes especially important during large plastic deformation and necking.
What is necking?
Necking is the localized reduction of a tensile specimen’s cross-sectional area that develops after the material reaches its ultimate tensile strength. Deformation becomes concentrated in this region, eventually leading to fracture.
What is the area under a stress-strain curve?
The area under a stress-strain curve represents the energy absorbed per unit volume of the material during deformation.
The area under the curve up to the elastic limit is associated with resilience, or the energy that can be stored elastically. The total area under the curve up to fracture represents the material’s toughness, which describes its ability to absorb energy before breaking.
What is the difference between yield strength and ultimate tensile strength?
Yield strength indicates the stress associated with the onset of significant permanent deformation. Ultimate tensile strength (UTS) is the maximum engineering stress reached during a tensile test.
A material can therefore continue carrying additional load after yielding and reach a higher stress before reaching its UTS.
Why do different materials have different stress-strain curves?
Different materials have different atomic structures, microstructures, compositions, and deformation mechanisms. These factors influence properties such as stiffness, yield strength, strain hardening, ductility, and fracture behavior.
Even within the same material family, factors such as alloy composition, heat treatment, temperature, and strain rate can change the shape of the stress-strain curve.